
Creating Animated Charts
The following charts were created a very long time ago for my girlfriend at the time (2002), who wanted some animated charts for an Excel presentation at work. Not long after we had a request to display data in a chart which moves on a periodic basis so there was a baseline to work from. This can be very useful especially if you want to show data aligned with rolling forecasts. Displaying the last 12 months in a given period need not be as manual as changing all of the charts every month or quarter to update the chart for the last n periods.
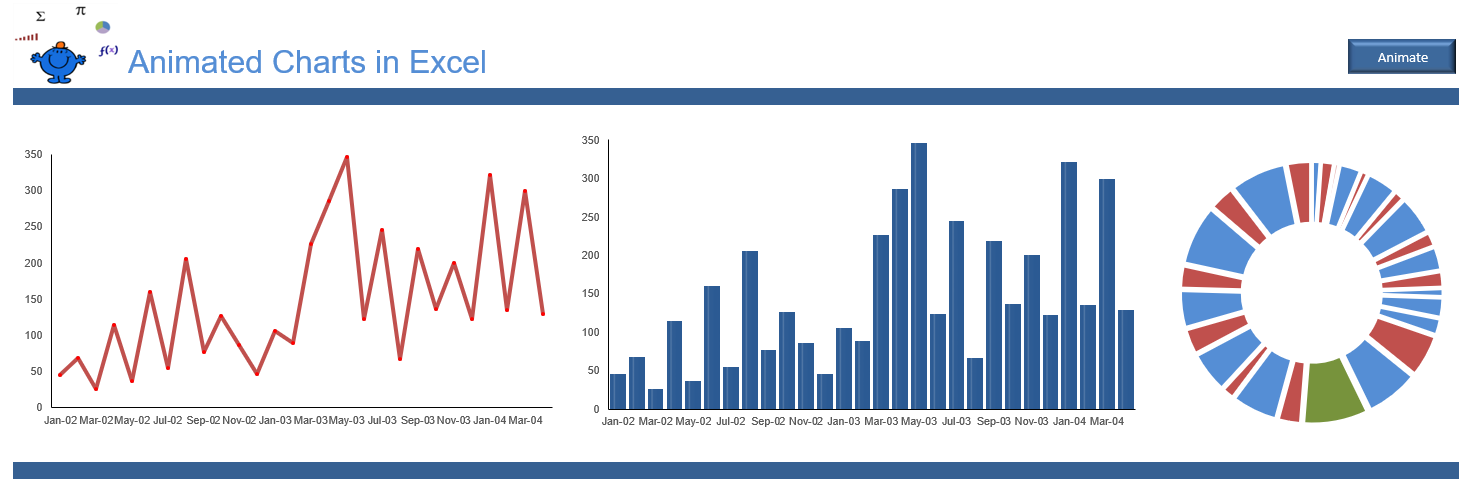
The way it is done is with named ranges and a small amount of VBA. I am sure this could be done without VBA and I may get round to replicating this without code one day (LOL it is now 2020). I have set this more modern day example up with static data from 1 data source so you can see how a line chart, a column chart and a bar chart animate with this VBA procedure.
The Static Ranges which are controlled by VBA are originally titled.
Header
xData
So if you are putting this procedure in your workbook just use the same named ranged for the header and chart data (xData). I have used the x to prefix the named ranges to show that these are the labels which are referred to in the Chart.
Setting Up Chart Animation
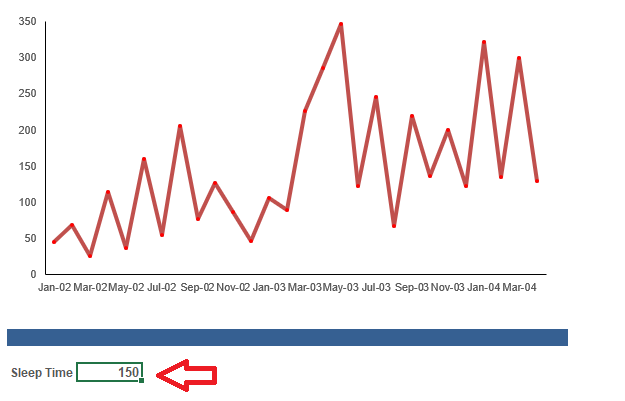
In this setup we will check the setup to see if the system is 32 or 64 bit then we can set up the time lag for the macro. The time lag will be all important to ensure the look and feel is smooth. This is best between 100 and 300 milliseconds.
Option Explicit
#IF VBA7 And Win64 Then 'Check 32 or 64 bit
Public Declare PtrSafe Sub Sleep Lib "kernel32" (ByVal dwMilliseconds As Long)
#Else
#End If
The above goes in a normal VBA module at the top where you would declare any VBA variables.
VBA to Control the Charts
The following will control the whole process calling the Increase or Decrease routine each time the spinner Button is clicked.
Sub Animate() 'Excel VBA macro to animate chart
Dim i As Long
Dim rng As Range
[xData].ClearContents
rng = rng.Offset(6, 0).Value
DoEvents
The important parts of the above code are the named range (xData) and the time lag for the charts to update and this is in cell C29 on the active sheet. This needs to be considered. Be aware that the charts source data is stored 6 rows below.
rng.Offset(6, 0).Value
So change the number 6 if your data set up is different.
Changing the Chart Data
Finally the data in the for the chart is offset 6 rows below the charts source data. In the Data tab look for the data which is in the table below row 1 and 2 which hold the named ranges
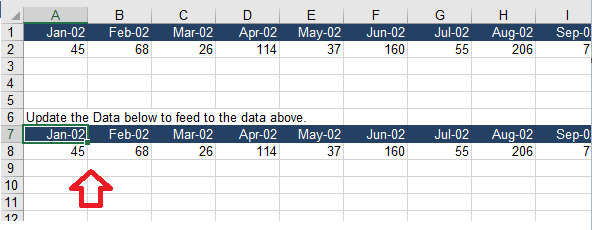
The data in line 8 needs to change then everything will be all set if you are using this methodology. Hope this animated charting procedure was helpful. Enjoy.
