
World Cup Wall Chart in Excel
In celebration of the world cup, I have put together a Brazil world cup excel wall chart which enables you to track matches and predict who might make the final stages of the tournament. The Excel dashboard tracks matches and gives group summaries on one summary sheet. It is a bit of fun and this Excel dashboard can be customised for any sporting tournament. I have not protected the Excel wall chart with a password so you can easily change the file and see the inner workings.
While designing the wall chart in Excel I found the more circular flags I put in the file the slower the response time of the file. As a result I have kept these flags to a minimum to help the speed of the dashboard. The final stage is flag free which was disappointing for me. If someone knows a way to include loads of flag pizzazz without losing speed and dexterity I would love to hear of it?
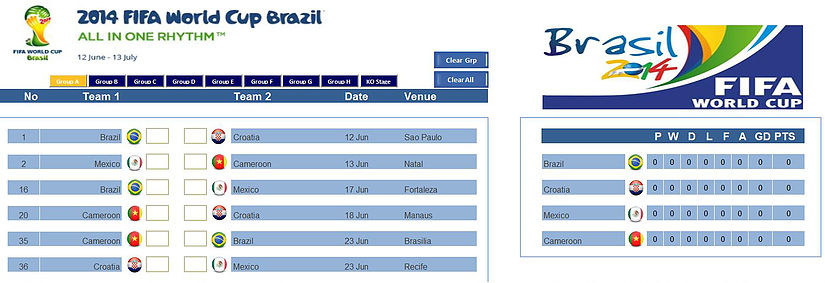
The above is the main page of the Excel wall chart dashboard. Click on a group buttons and the flags and teams will change. The active group will have the sheet tab button appear in yellow. All of the information is stored on another page and by entered data above you will update that page.

This is the file, it is fit for Excel 2003 or later. I designed the formula so it will work in this earlier version. The file defaults to an instructions page to show some more detail on how to update the Excel file. Enjoy the World Cup and the dashboard!!!!!
