

How to Share Un share an Excel Workbook
Recently I was assisting someone on a forum and the workbook they had supplied had been saved as a shared workbook. I have not used shared workbooks and was at a bit of a loss regarding how I might un share the document. I needed to un share it in order to make changes to the structure of the workbook – add lines/columns. These are the steps to share or un share a workbook.
Read More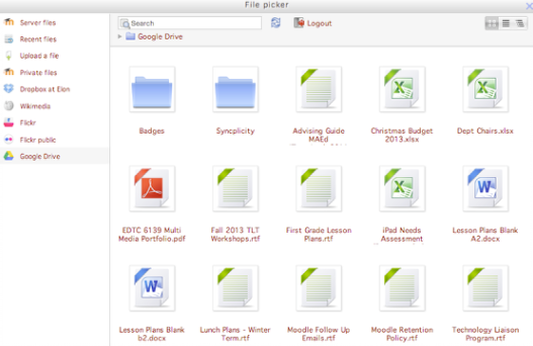
VBA Open File Dialog
During a procedure you may wish your user to choose a file to open. This can slow the process of running code down but if you have a moving target this will be essential in getting the right data imported or manipulated via VBA. I have not had to do this very often but a client asked if they could choose a file mid procedure and the following is what I came up with.
Read More
Adding Mulitple Criteria in a Single Column
Creating a sum where the criteria is in the same column has usually been about creating a sumif or sumifs and adding multiple iterations together. This turns formula which intuitively should be short into long, difficult to read formulations. With the intelligent use of Sumproduct you can use one formula to capture multiple criteria in the same column. Here is an example.
Read More
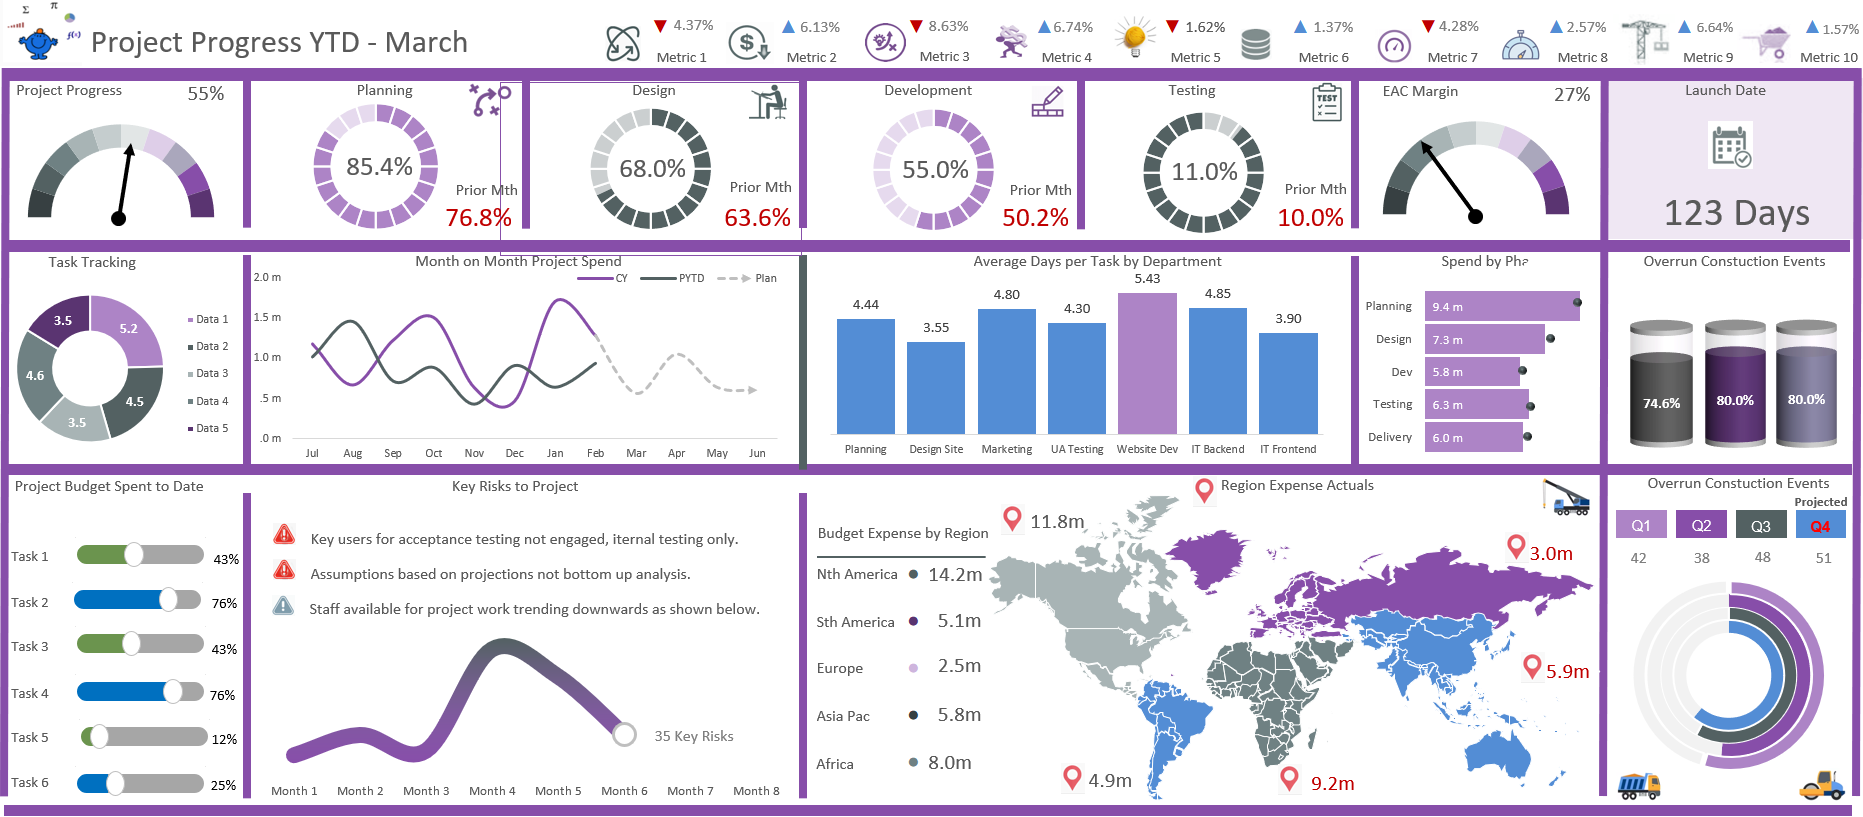
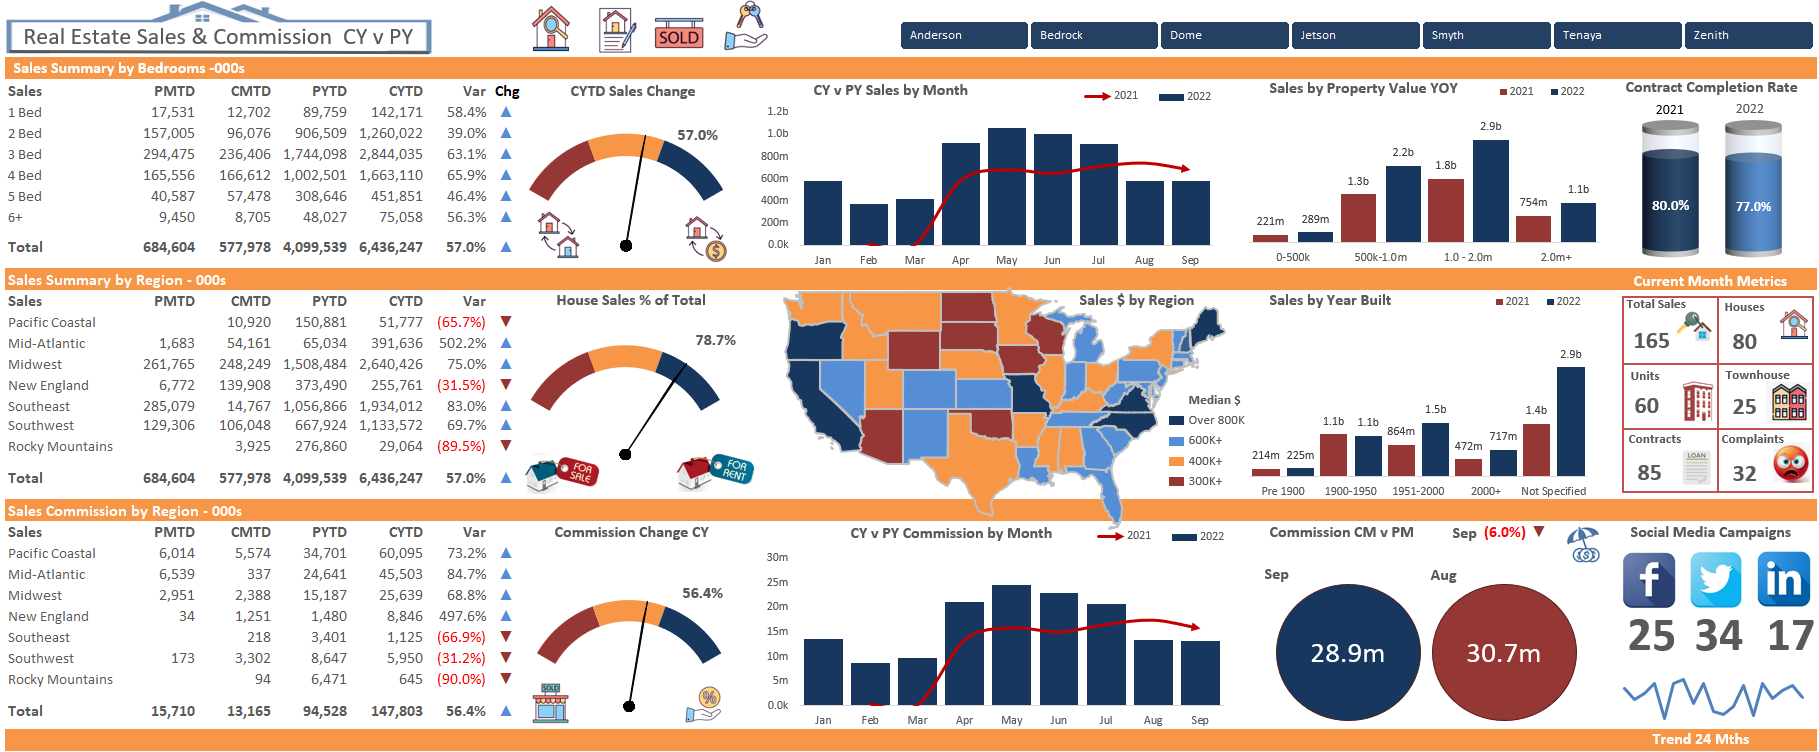
Infographics in Excel (part2)
The introduction of infographics in Excel to the site has grown faster than I anticipated. The above image is just a sample of some of the infographics on the main part of the site. It has been a bit of a learning experience as I have picked up tips and tricks from the extensive online resource. I will continue to grow the infographics section until I run out of room which seems to be about 25 items in the menu. Not too far till I get there so will just add them to my blog if I ever reach that number.
Read More
Group Like Data with VBA
Grouping information in Excel is a way of hiding data, while telling the user there is data hidden. In my opinion it is a preferable way to "hide" information as you are aware that there is data grouped. Hidden rows in the conventional sense are often hard to detect. You may find out by accident after you have copied information that there were rows hidden. It is often a surprise.
Read More
Copy Multiple Sheets with VBA
I was asked during a webinar recently how you send multiple worksheets to a new workbook in a batch. I was pretty sure this information would be on my site but a quick search of my site did not reveal any joy.
I put together a simple file which sends an output sheet and two source data sheets to a directory saves it then starts the process again after changing a unique identifier. The process is a little more in-depth than sending just one sheet but there is not a great deal more code involved.
Read More
Isolate Sub Groups in Excel
There are times where you may wish to report sub groups within departments. It can be difficult when the sub groups are varying lengths. Here is a solution to that problem. The formula will test for the first item in the sub group and return a result, then test for a second sub group and if found return a result.
The formula is as follows.
=IFERROR((OFFSET($B$7,MATCH($A$32,$A$8:$A$18,0)+
IF(COUNTIF($A$8:$A$18,$A$32)>(ROW(B32)-ROW(B$32)),(ROW(B32)-ROW(B$32)),NA()),0)),"")
Read More
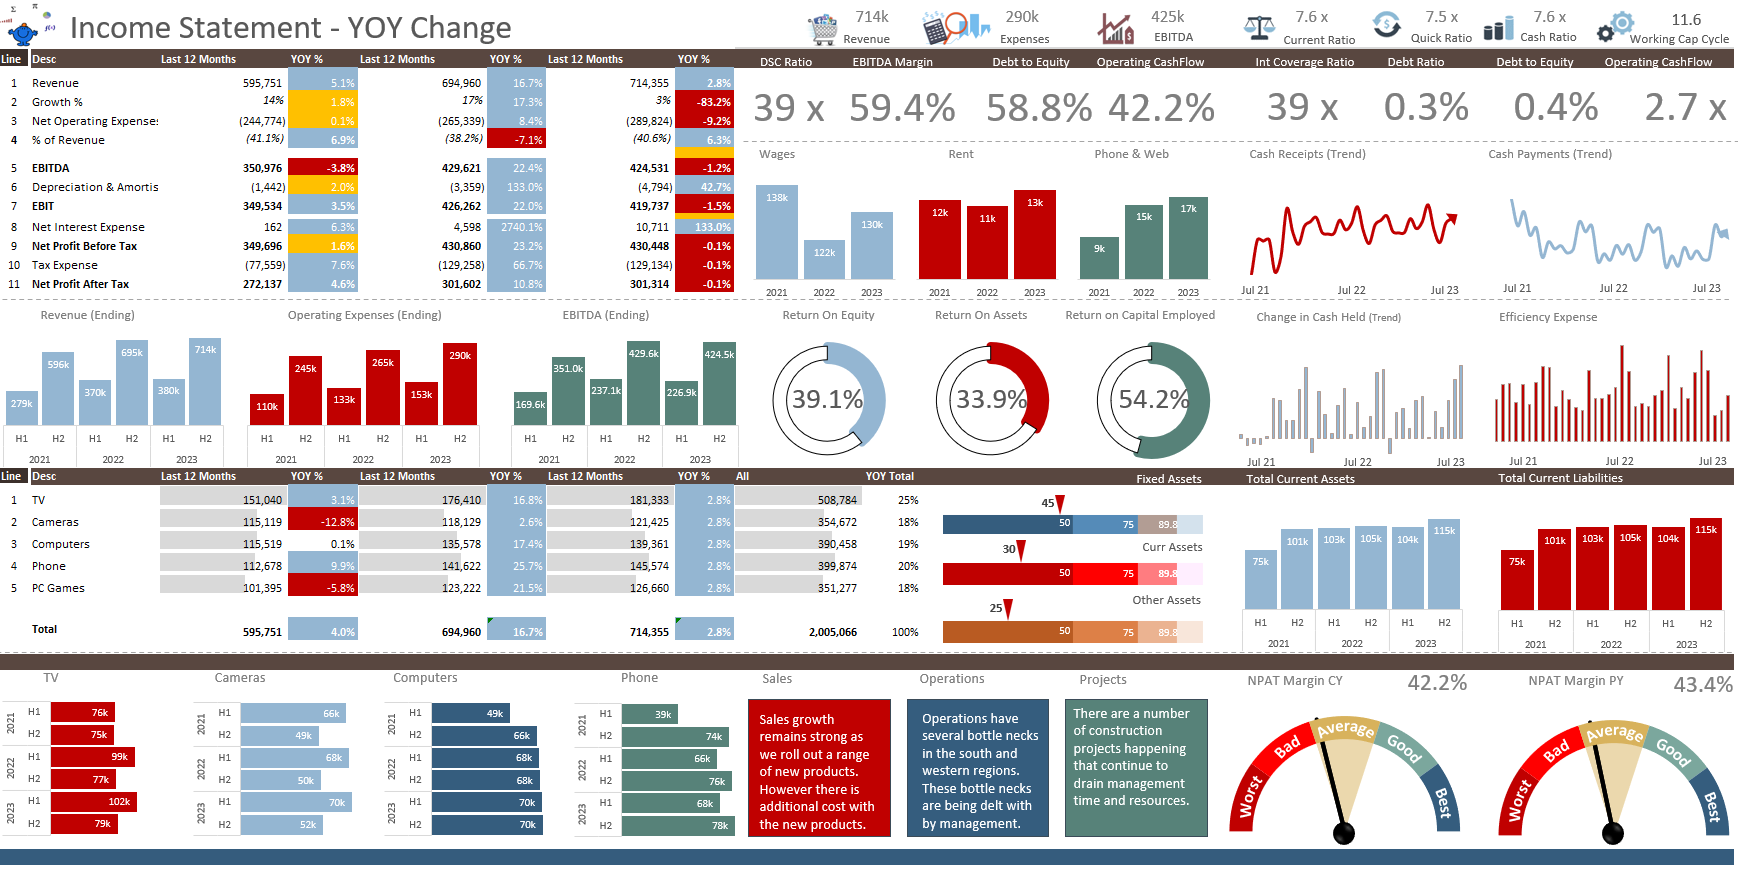
Infographics in Excel
Infographics in Excel is not a new concept but these sort of graphical representations are very powerful and convey a striking message. Infographics are usually not as dynamic as a dashboard, they tell a striking story. This is not to say that the source data which populates the infographic can't be dynamic in nature.
My website is about to explode with Infographics as I publish a swath of interactive Excel Infographics for people to plug and play with.
Read More
Social Media Dashboard in Excel
A social media Dashboard. It outlines social media activity, visits to pages, likes, retweets. The dashboard focuses mainly on Pinterest, Facebook, Twitter and Google +.
Read More
Incident Tracking Dashboard
The dashboard tracks incidents by year and by cost. It is only a small dashboard but has stacks of functionality.
Read More
Evaluate and Filter Part 2
This post is a follow up from the blog post earlier in the month on Filtering without a filter. It is an alternative to the autofilter method I have outlined extensively. The post focuses on filtering out more than one criteria and putting the results in a fresh sheet. To do so we use the evaluate method. This is relatively complex, however if we break down what needs to change we can significantly simplify the process.
Read More

Move Sheets Based on a List with VBA
I recently had a problem, I had a summary sheet which was calculating all of the data between a beginning sheet and an end sheet. However, the sheets in-between the begin and end tabs were changing based on a selection from a list. What I wanted was the flexibility to move the sheets in and out based on what had been selected in this list. The summary will be updating once the procedure runs and the end result needs to be flexible.
Once again we will need VBA to produce a result.
Read More
Evaluate and Filter in Harmony
Performing a check on things like the sheet name with the Evaluate method avoids a looping construct. This tutorial show you how it is done.
Read More
Bubble Chart in Excel
Creating Bubble charts in Excel is reasonably straight forward. They are very similar to a line chart without the line and with a bit more pizazas. You will find quite a few Bubble Charts onthesmallman.com particularly in the dashboard section.
The following article will take you through how to make one.
Read More
Format Chart Numbers as Thousands or Millions
Recently I have been creating some comparison charts (prior year agains projections) and usually the numbers in my tables have been in a format which would suit. In this recent project though the data was in large whole numbers and I wanted to format this into a chart so it appeared as millions. In order to get from whole numbers to millions I had to work with the number format in what was a slightly unintuitive way and I hope by sharing this that I save you some time in the process.
Read More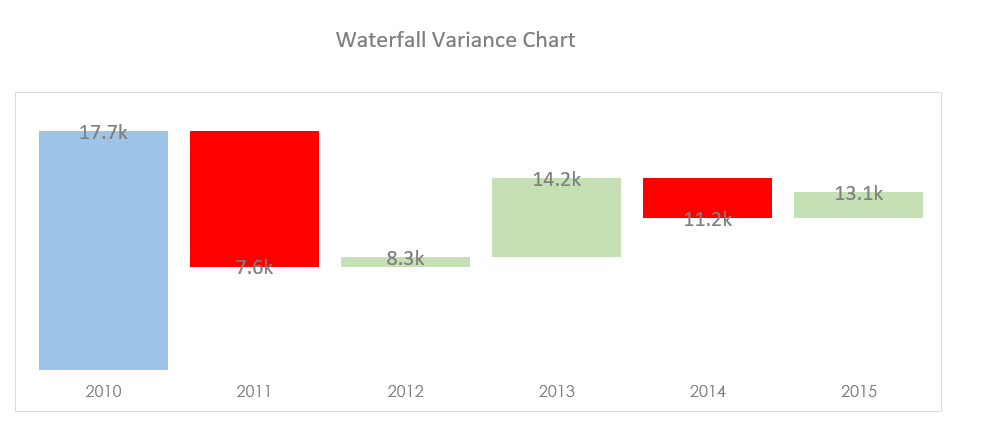
A Self Colouring Waterfall Chart
The waterfall chart has been around a while and whenever using them the charts have always frustrated me because they were coloured manually. I decided to have a crack at the problem to produce a chart with 3 different colours, red for when there is a downward trend, green for when there is an upward trend and no colour to help emphasise the movement.
I have done some work in the past and these are the waterfall models I have linked to the Smallman.com
Read More
Showing Trends with a Chart
Adding a bit of pizazz to charts can be difficult at times. I tend to stick to what I know works when comparing say budget to actual. What is nice is to add some trending data to the conversation. I think it adds value from a visual perspective. It is nothing the user cannot see when actual is against budget or forecast. It just adds an extra element to the chart. I prefer to add trend data as a Line chart rather than use Excel’s inbuilt trending tool. There is more flexibility in the formatting of a Line chart.
Read More
Filter Data in VBA without an Excel Filter
In Excel VBA it is possible to apply a filter directly to items contained within an array. This method, little known, is a way of filtering without the more traditional auto filter. I have not conducted any tests but as the filter is performed in memory I assume the process happens more quickly than a regular Excel auto filter. This would make a nice Excel case study.
Read More
Excel VBA to Sort an Array
I was recently researching the sorting of an array. I sat in my reading chair and read through John Walkenback’s excellent Power Programming tome on the subject and did some research online when I came across the brilliant .Net feature System Collections ArrayList. What a find it was as this feature allows you to sort an array and send that array right back into Excel.
Read MoreFeatured Posts

Recent Posts

Split File into Parts and Save to Directory April 20, 2024
Most Popular Author December 14, 2023
Creating an Excel Dashboard - A Guide with Templates December 8, 2023
Real Estate Excel Dashboard October 11, 2023

Updating Excel Dashboards September 29, 2023

TheSmallman in Another Top Blog Rank April 24, 2023

Project Tracking Dashboard March 25, 2023

Excel Unique Formula September 17, 2022

Horizontal Range to Vertical Range in Excel June 15, 2022

Hiding Rows Quickly with VBA May 20, 2022