
Income Tax Calculator in Excel
Calculating income tax can be an arduous task with many steps which require a keen eye and a calculator at the ready. Excel formula can be used to calculate tax. Generally taxation tends to be presented in stepped tables. Income is taxed at a certain rate within bands inside the table. Most people have a personal allowance, an amount they can earn before getting taxed. The rates of Income Tax you pay depend on how much taxable income you have above your allowance.
For example, the current Australian Taxation table is as follows;
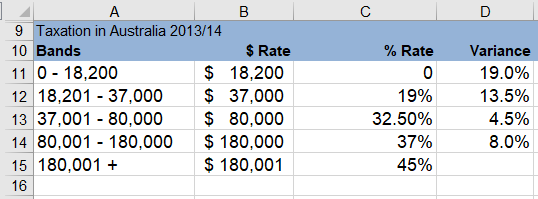
You can see from the above the personal allowance cuts off after $18,200. So all income below $18,200 is not taxed.
The problem when calculating the final taxation for any individual is that you are given one figure and within that figure live all the bands with different taxation rates. If you have a number of individuals and you want an idea of the taxation they will be expected to pay, you would traditionally require a formula of some length to cope with this scenario or a number of smaller calculations summing up to a Total Tax figure.
There are websites where you can enter a single dollar amount and the tax payable for the year is spat out. Here is an example of one such site;
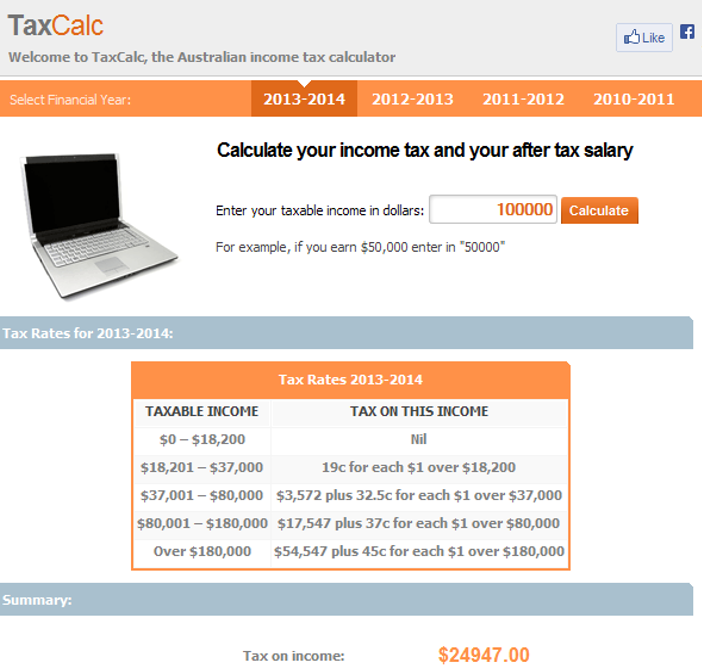
The Above ScreenShot from;
http://www.taxcalc.com.auThe resulting Tax payable on a salary of $100,000 per annum is $24,947. We would like to see a perfect reconciliation of this figure in our file below. The theory is made simple with the intelligent use of the SUMPRODUCT formula.
So I will show you how you could solve this problem with Excel. Using Excel's Sumproduct is interested in the ranges of these bands and the Variance between each Band. If we place our taxable income ($100,000) in Excel cell C22 the formula in long hand is as follows;
=SUMPRODUCT(--(C22>{18200;37000;80000;180000}), (C22-{18200;37000;80000;180000}), {0.19;0.135;0.045;0.08})
This Excel formula can be reduced to the following with cell references;
=SUMPRODUCT(--(C22>$B$11:$B$14), (C22-$B$11:$B$14), $D$11:$D$14)
Where cell C22 is the salary ($100,000) cells B11 to B14 is the $ Rate and cells D11 to D14 is the variance between each tax band. For example, the difference between 0 (the first band and 19% is 19%. The difference between 19% and 32.5% is 13.5%. See Table 1 above for further variances.
The following Excel spreadsheet is based on the Australian and UK 2013/14 Taxation bands. For good measure I have included a reconciliation from a website which produces Australian and UK taxation figures. These can be adapted for any stepped taxation scale be it in the US or any other country which uses the same methodology to calculate taxation. Hope this Excel files helps to explain the method more fully.
