
Premium Dashboard Bundle (12 Excel Files)


Premium Dashboard Bundle (12 Excel Files)
A bundle of 12 premium (plus 1 bonus file), ready-to-use Excel dashboard models. Models which have a range of organisational, operational and finance metrics. Change to suit.
This is a premium offering of high end tools, 10 Excel files aesthetically pleasing, clearly laid out financial dashboards to help your business, or project, more efficiently track and conduct financial information and data. All the tools and Excel dashboards are ready-to-use and instantly downloadable.
The tools that are included in this bundle are as follows:
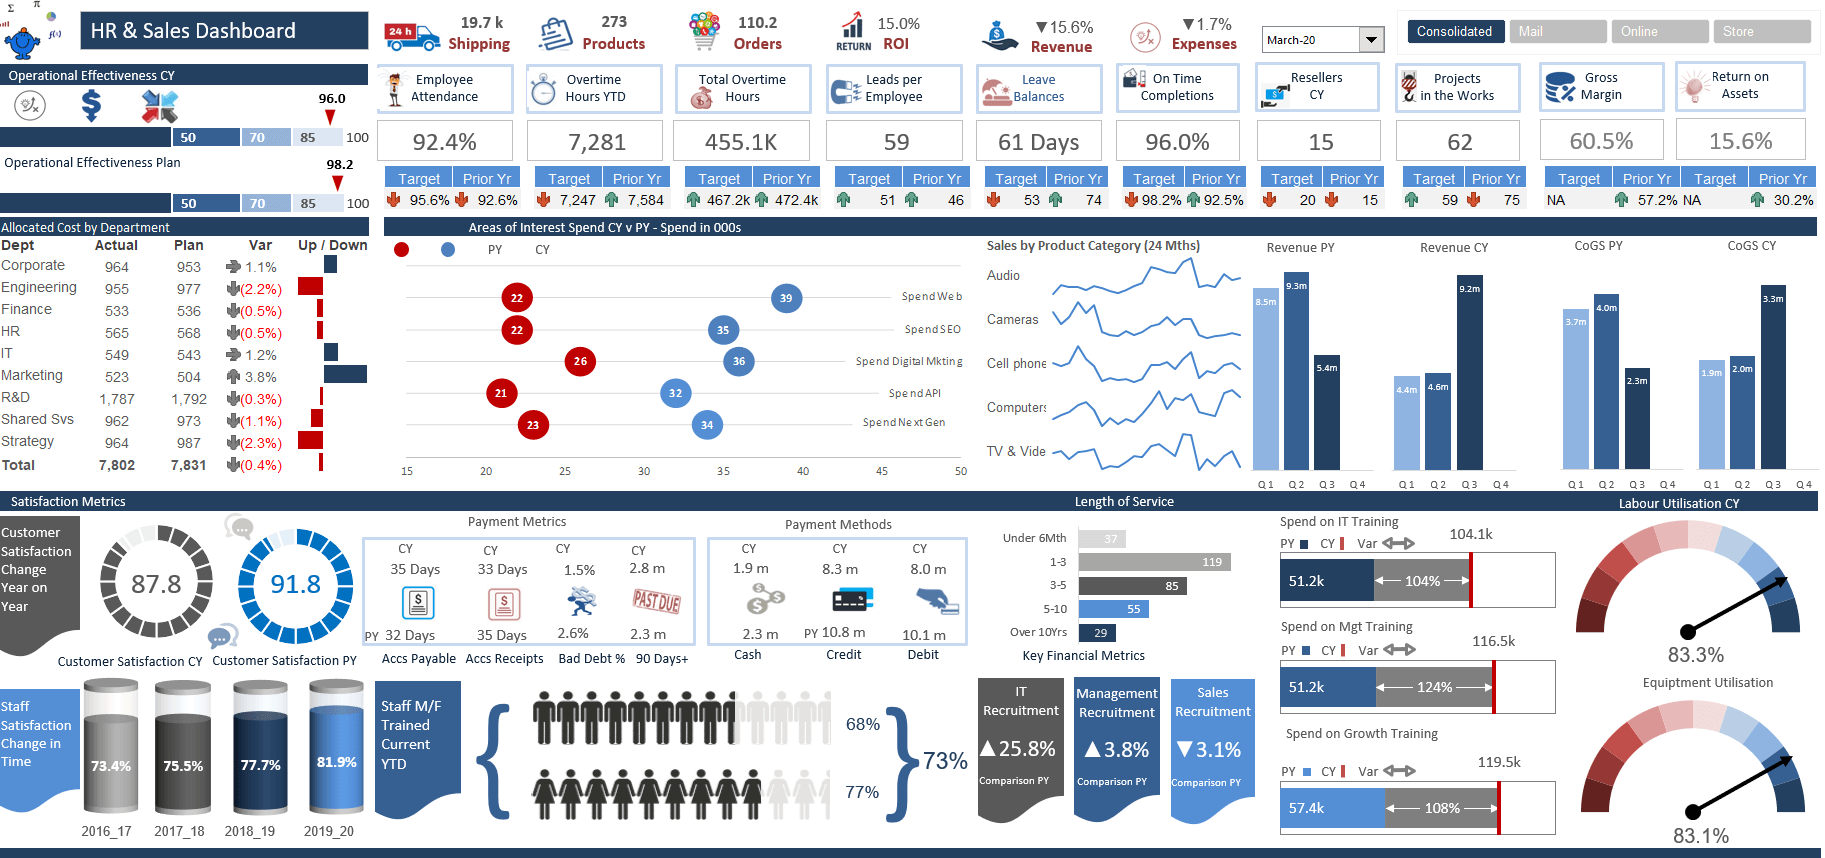
- Human Resources and Finance Excel Dashboard - presenting a range of metrics, including employee and customer satisfaction index, length of service, revenue, operational metrics, amongst others, in a clear and succinct fashion.
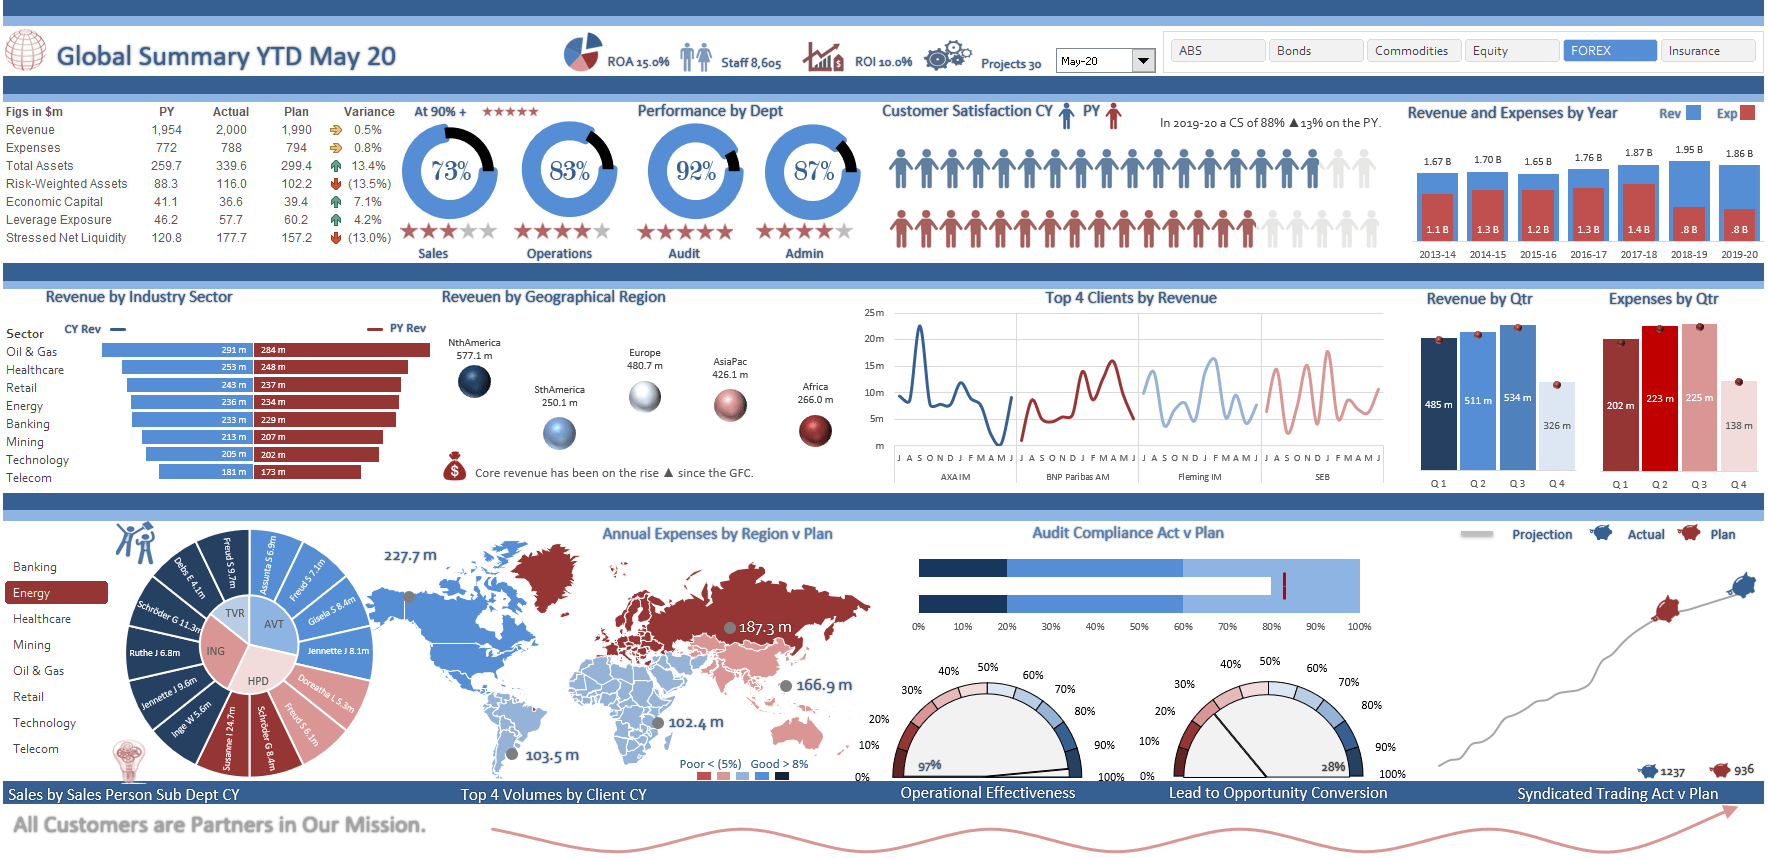
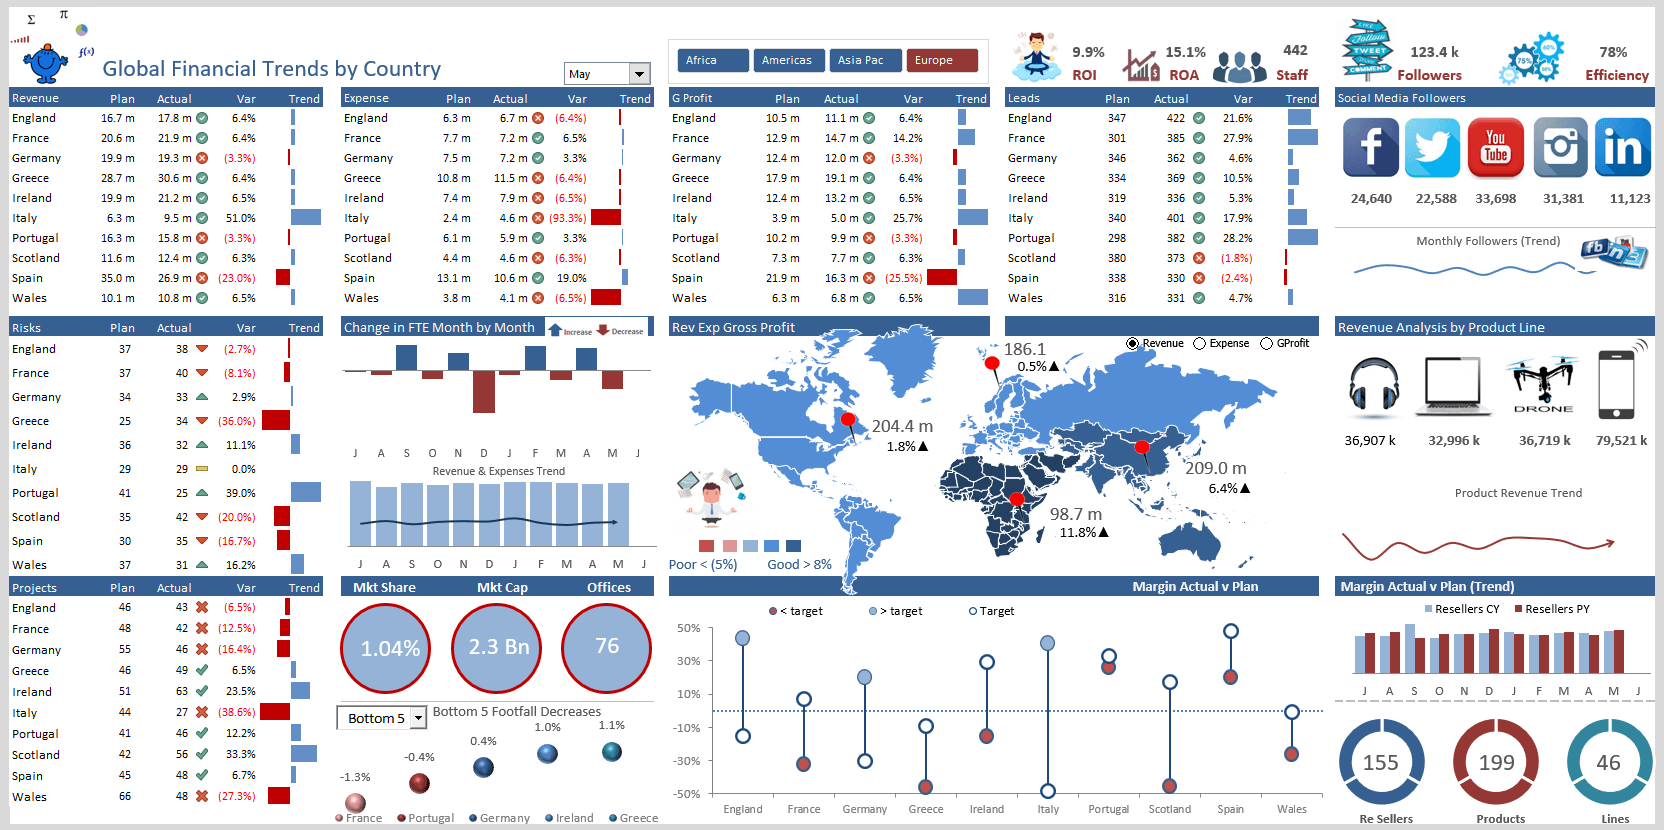
- Global Sales Excel Dashboard - offering a comparison of revenue and expenses by region by year, this dashboard has a heat map that lights up when a particular region is isolated. The entire dashboard changes colour based on the region chosen. It is highly sophisticated and aesthetically pleasing.
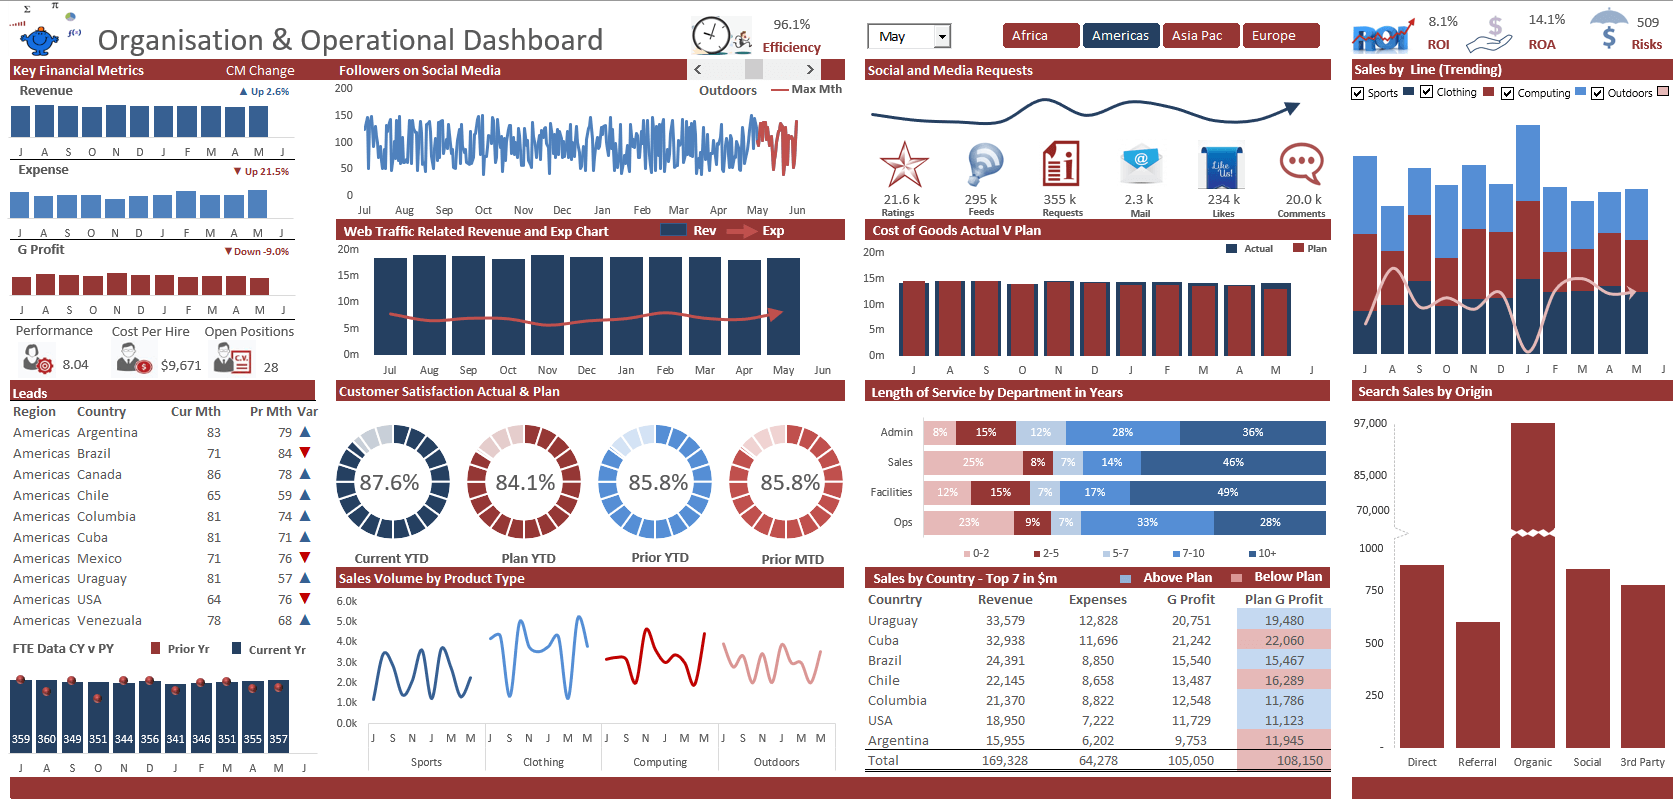
- Annual Excel Dashboard Model - Financial summary of the actual figures by department with a wealth of information including debtor data, social media, ROI and ROA.
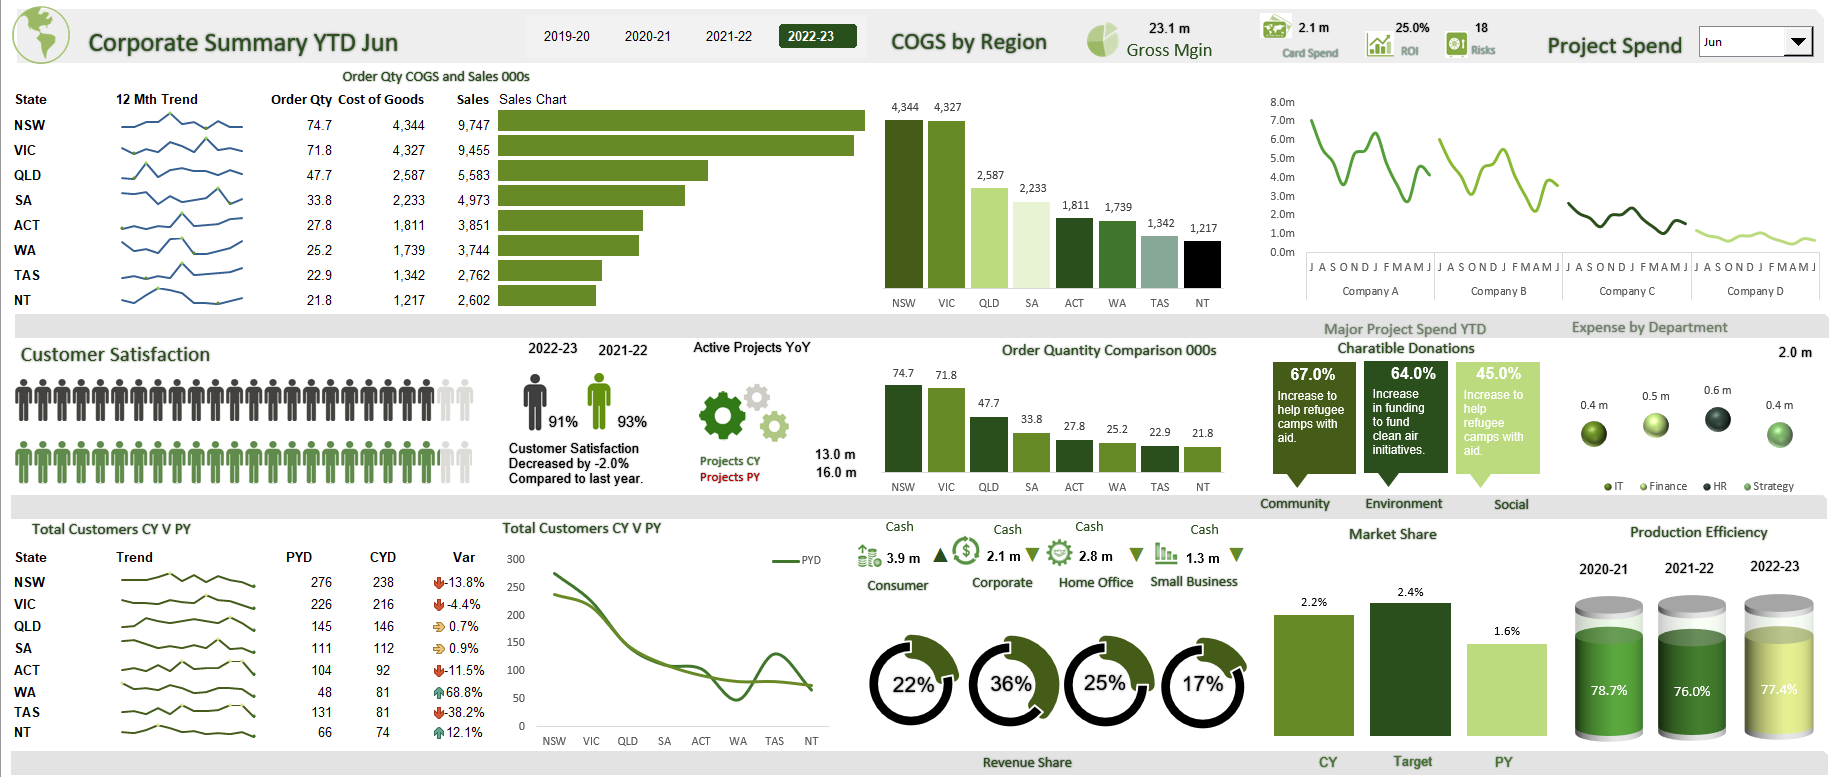
- Corporate Excel Dashboard Model - Neatly laid out consolidation of regional and data by group showing a range of financial and organisational metrics at a high level.
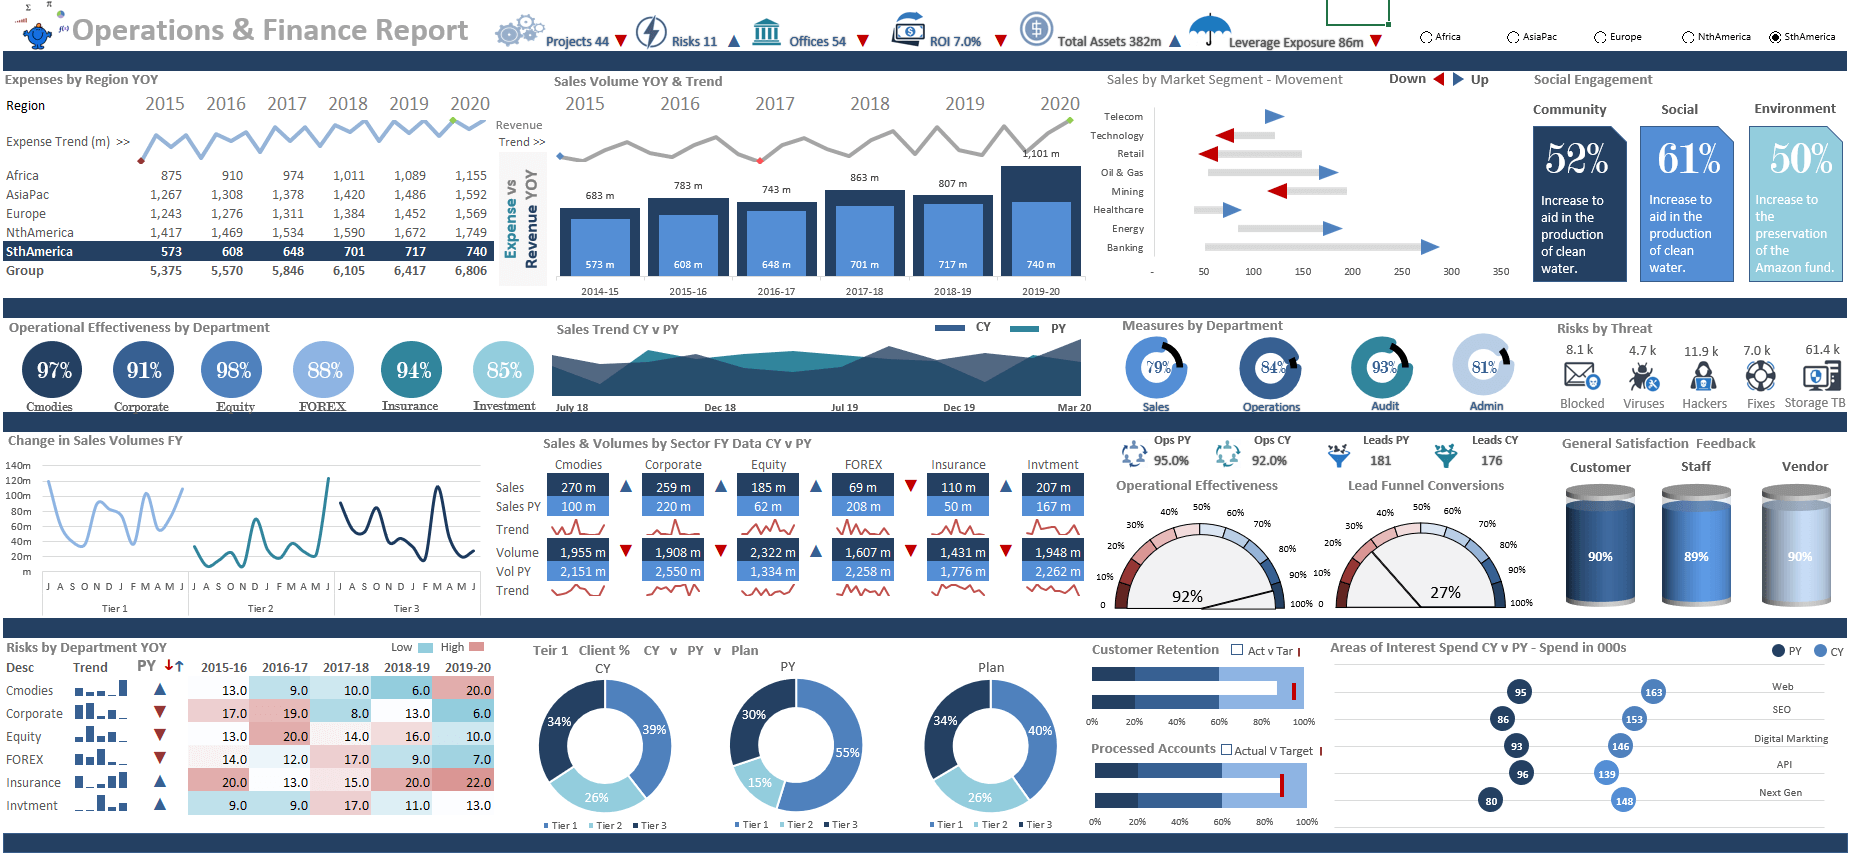
- Operational Excel Dashboard Model - a tightly constructed operational financial summary which shows data in a clear concise way, stacking current year and prior year data for quick seamless analysis.
- Whole of Organisation Excel Dashboard - Summarises financial metrics for different regions by YTD month, revenue by stream, FTE and human resources metrics all presented in a tabular logical format.
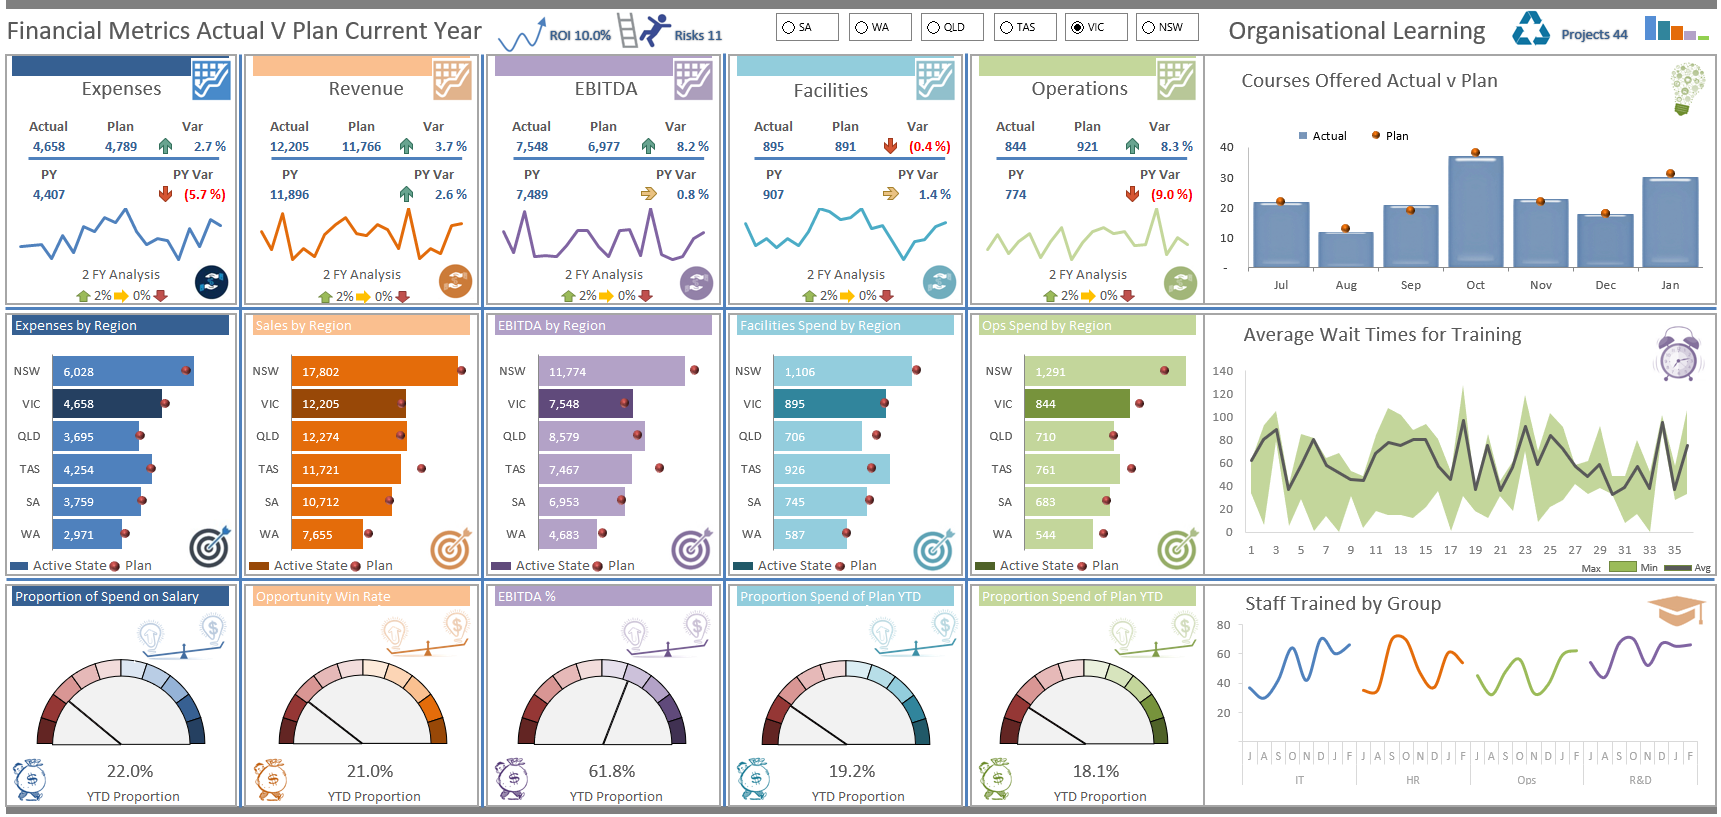
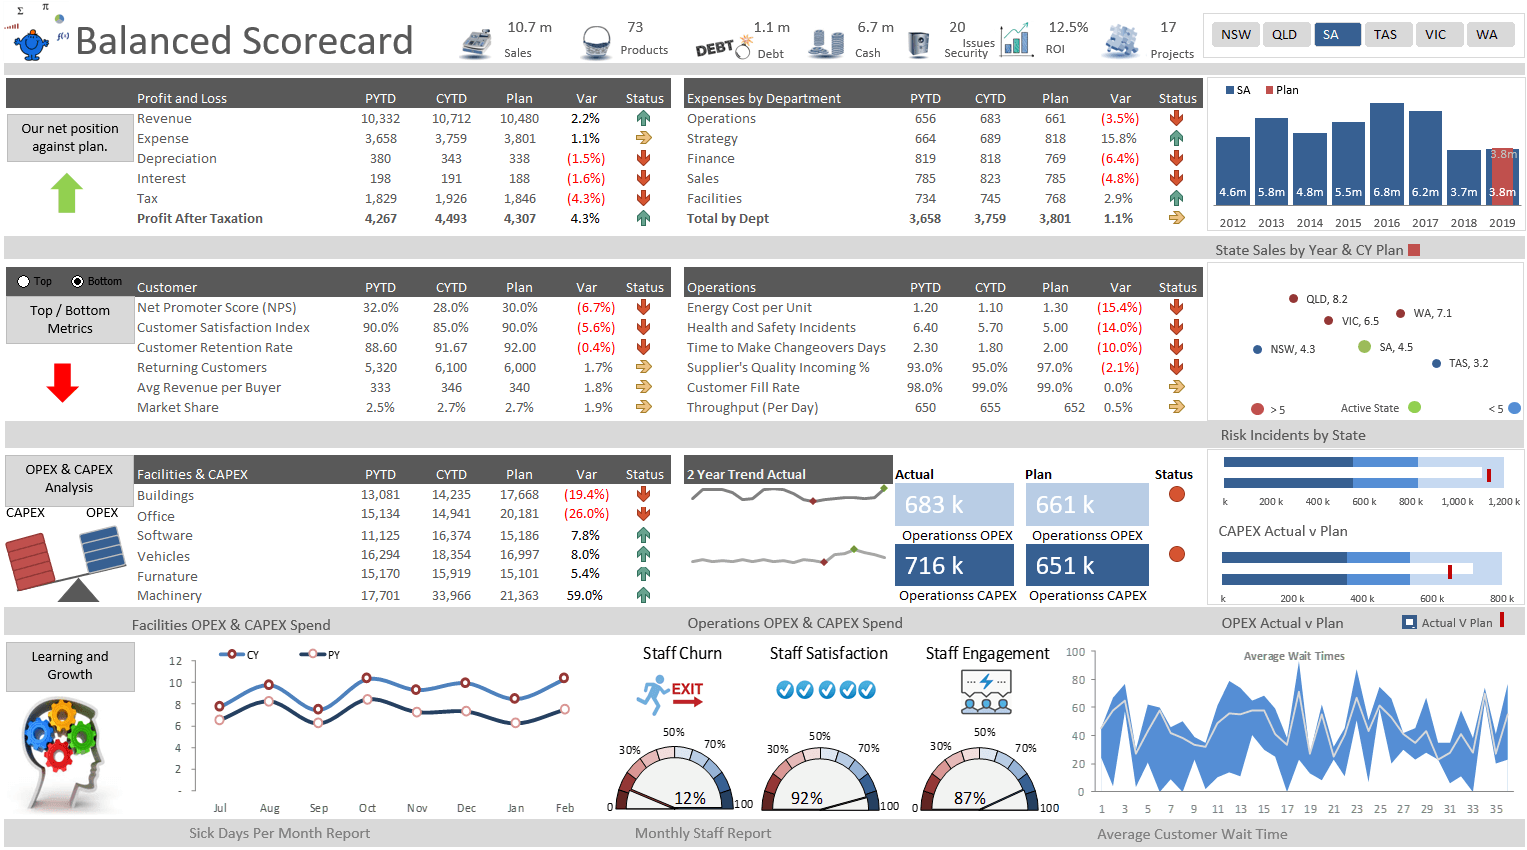
- Balanced Scorecard Dashboard Model - by region - This balanced scorecard summarises a number of important metrics, for 4 key areas within a company, financial, customer, operations and learning and development. The data is presented a a clean clear manner with some beautiful charting switches.
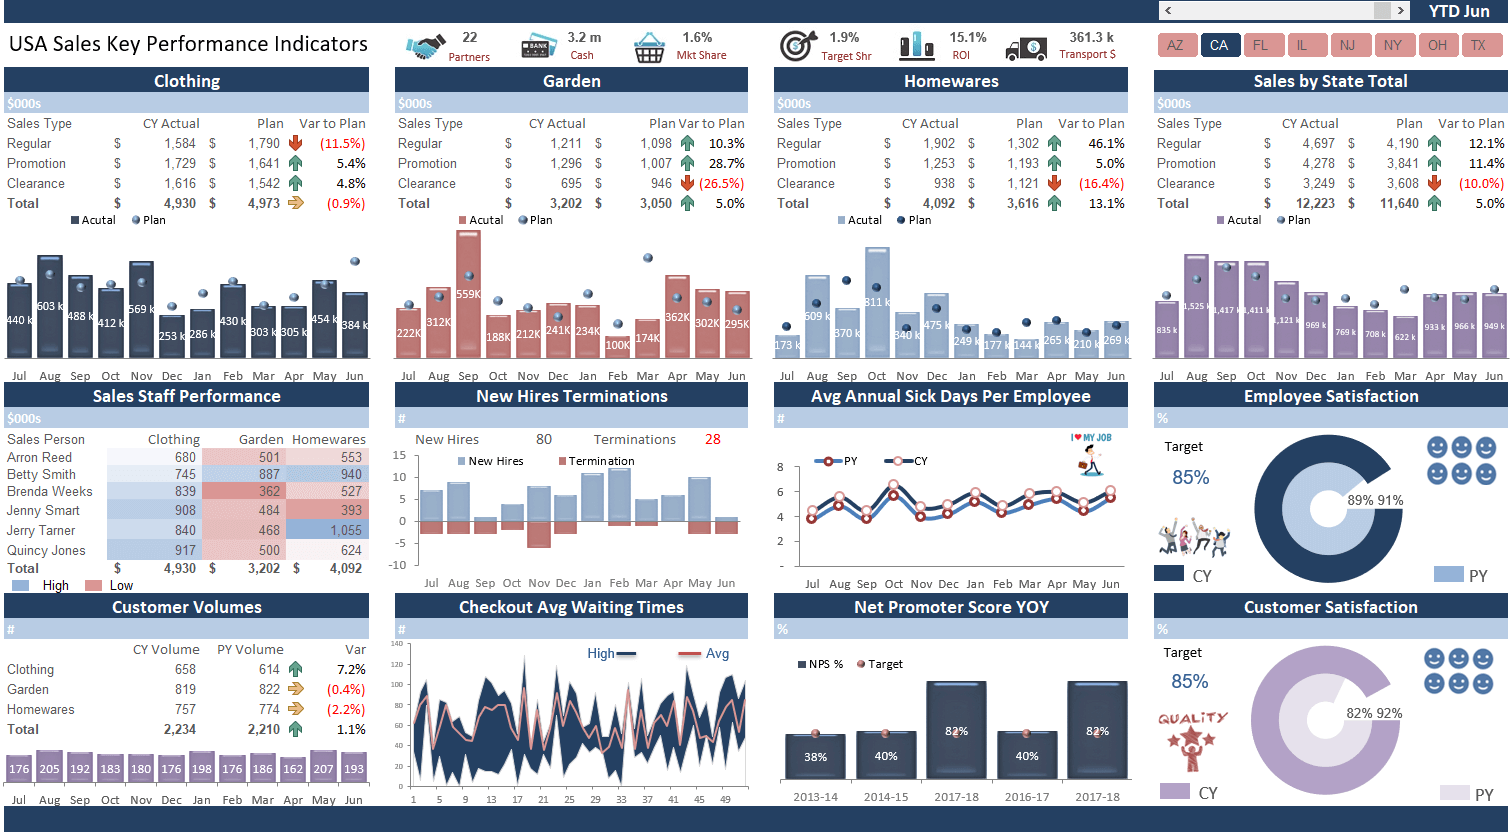
- Sales Excel Dashboard - providing high detail, consolidation by region, by department, sub department, client and sales person, this tool spins on the click of a button and is a terrific baseline for any business operating in multiple regions.
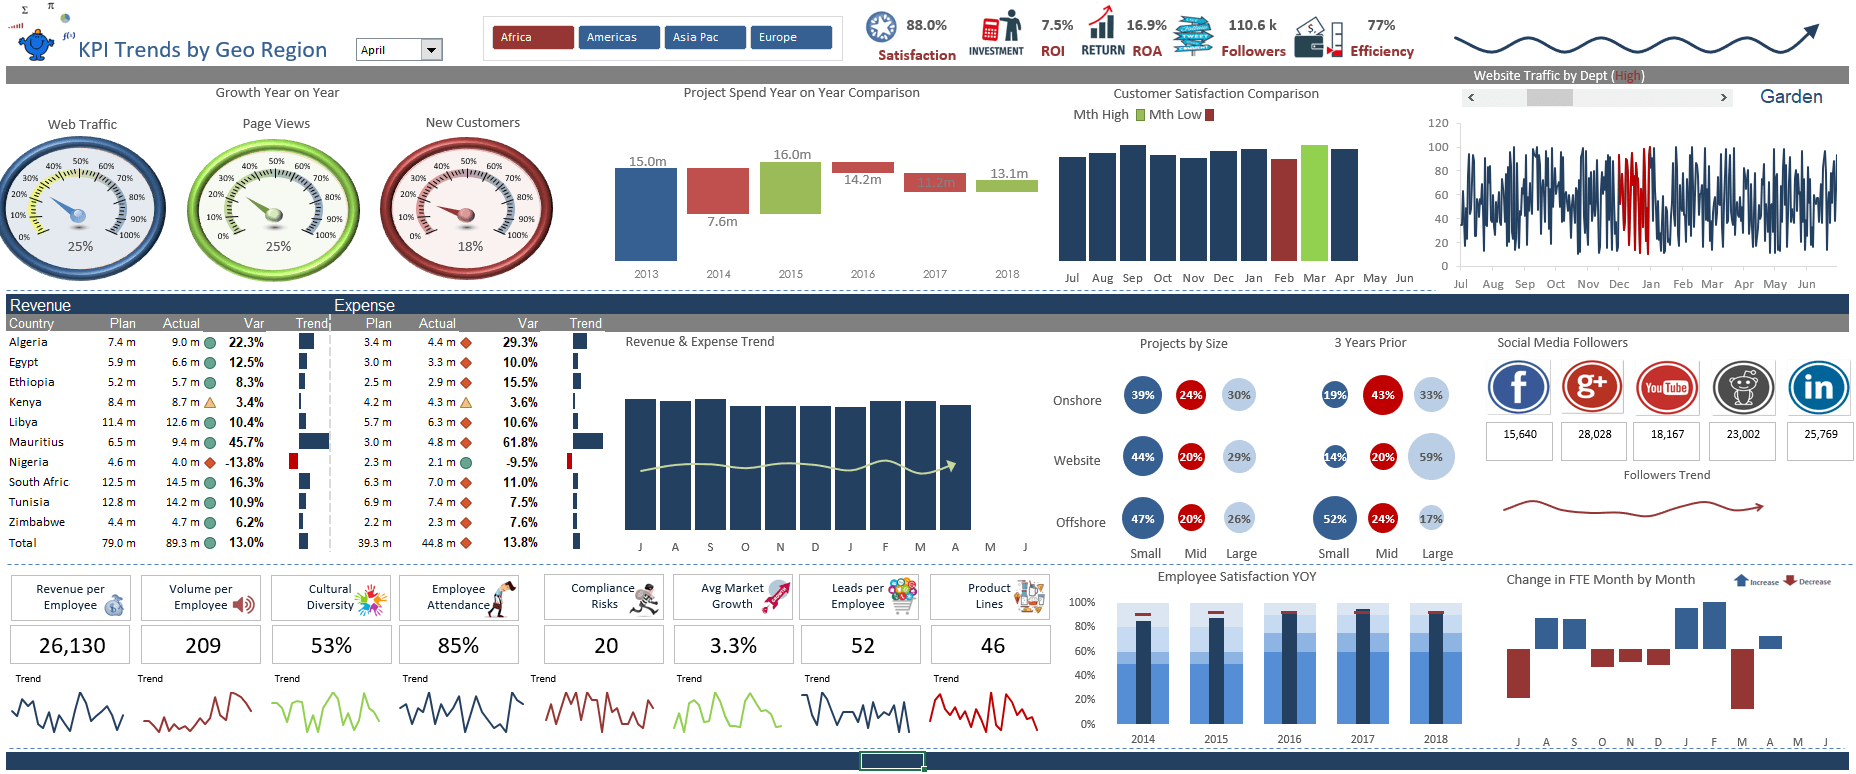
- Data Trends Excel Dashboard - gauge charts that automatically update, self colouring waterfall charts, financial, social and employee metrics all spinning with the aid of a slicer and a combo box to show YTD for the entire dashboard.
Included
11 Excel Files