
Corporate Reporting Dashboard

Corporate Reporting Dashboard
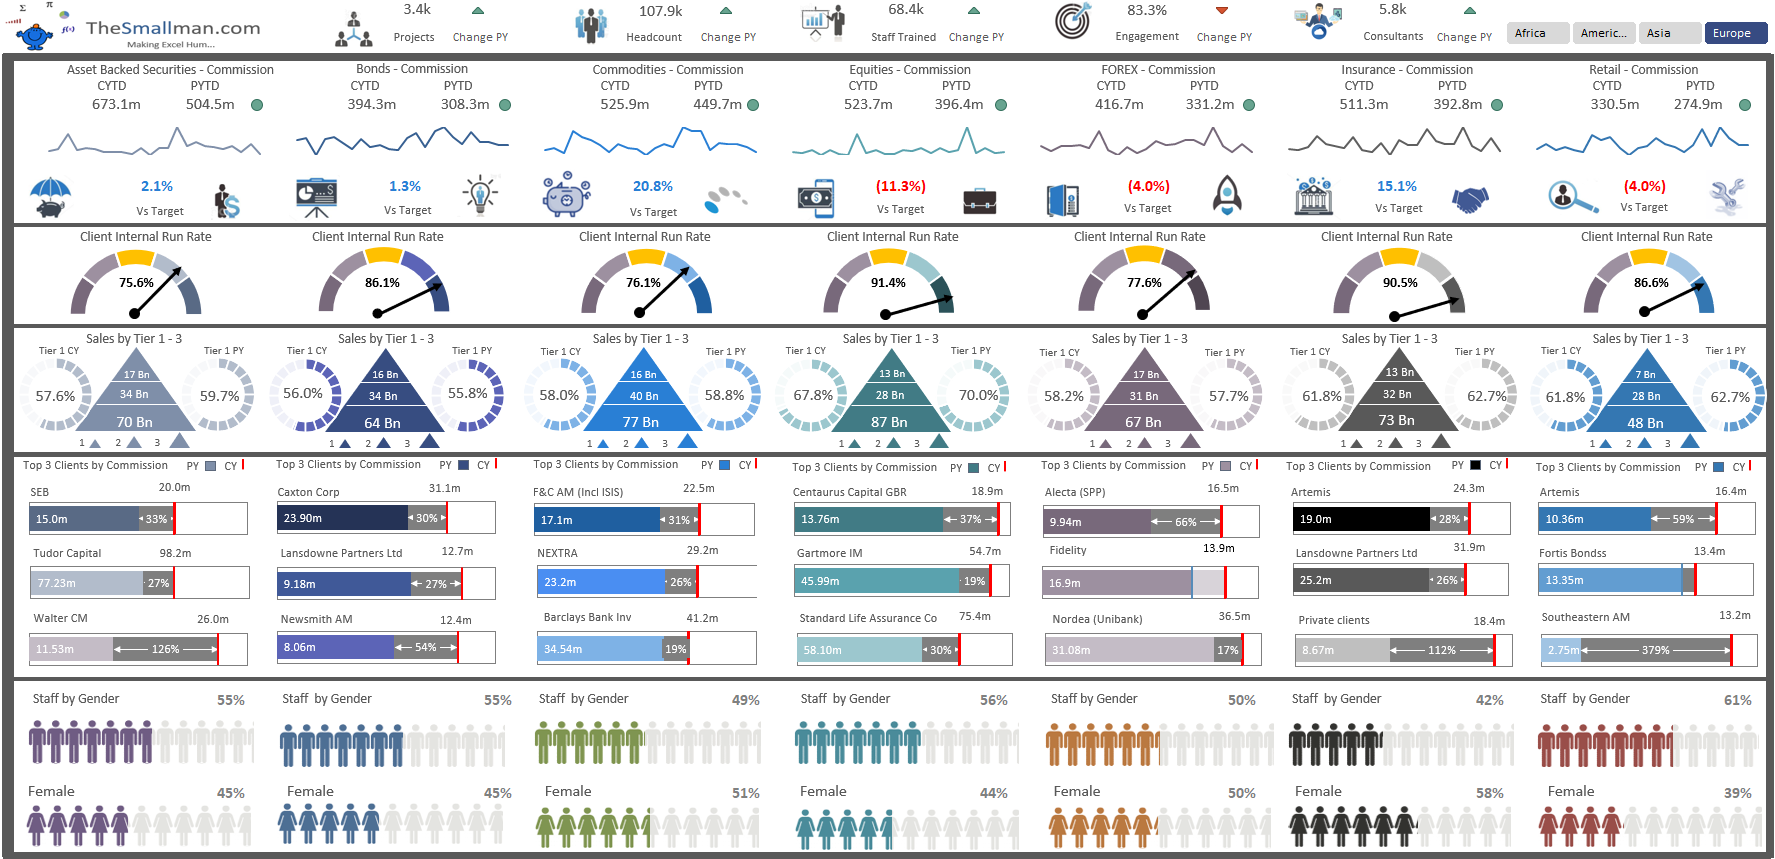
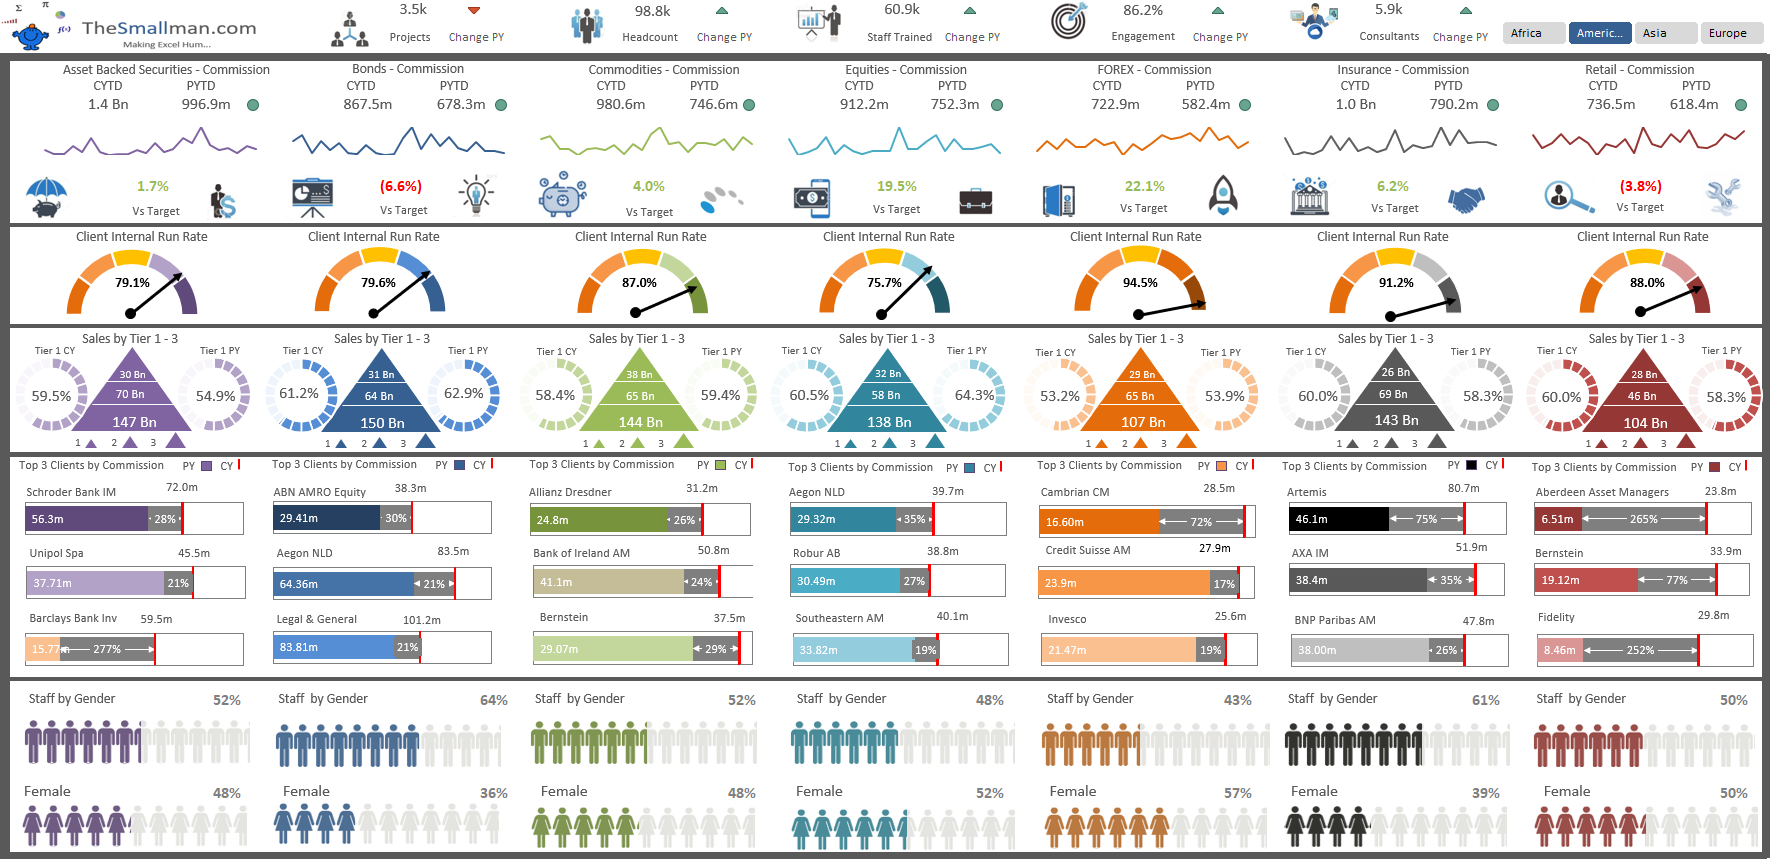
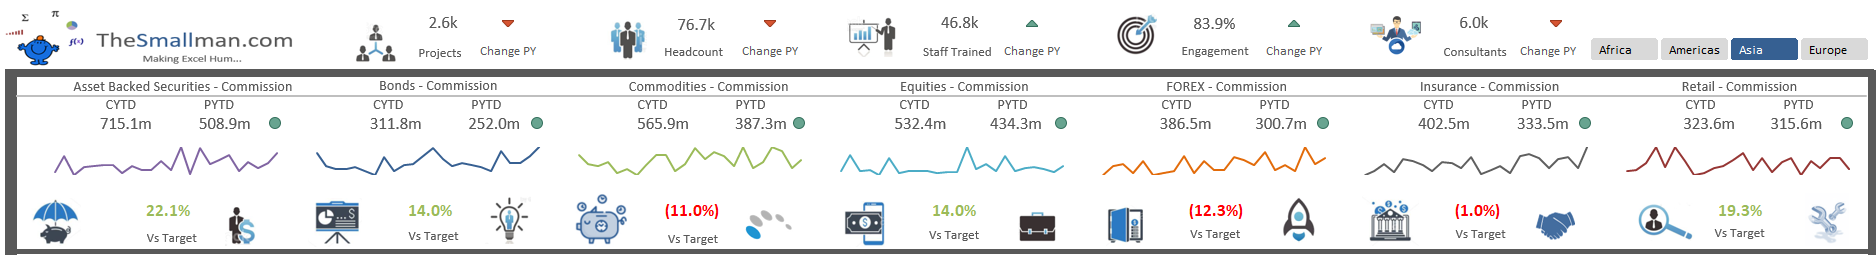
This is a highly detailed, yet succinct Key Performance Indicators dashboard for key operational and organisational metrics. Ready-to-use and instantly downloadable, this tool is excellently presented, whilst being clear and easy for the user to manipulate.
This corporate reporting dashboard is an important resource for professionals to monitor and track the strengths and weaknesses of specific department areas, in order to increase performance. Within this tool are a number of key metrics, these include:
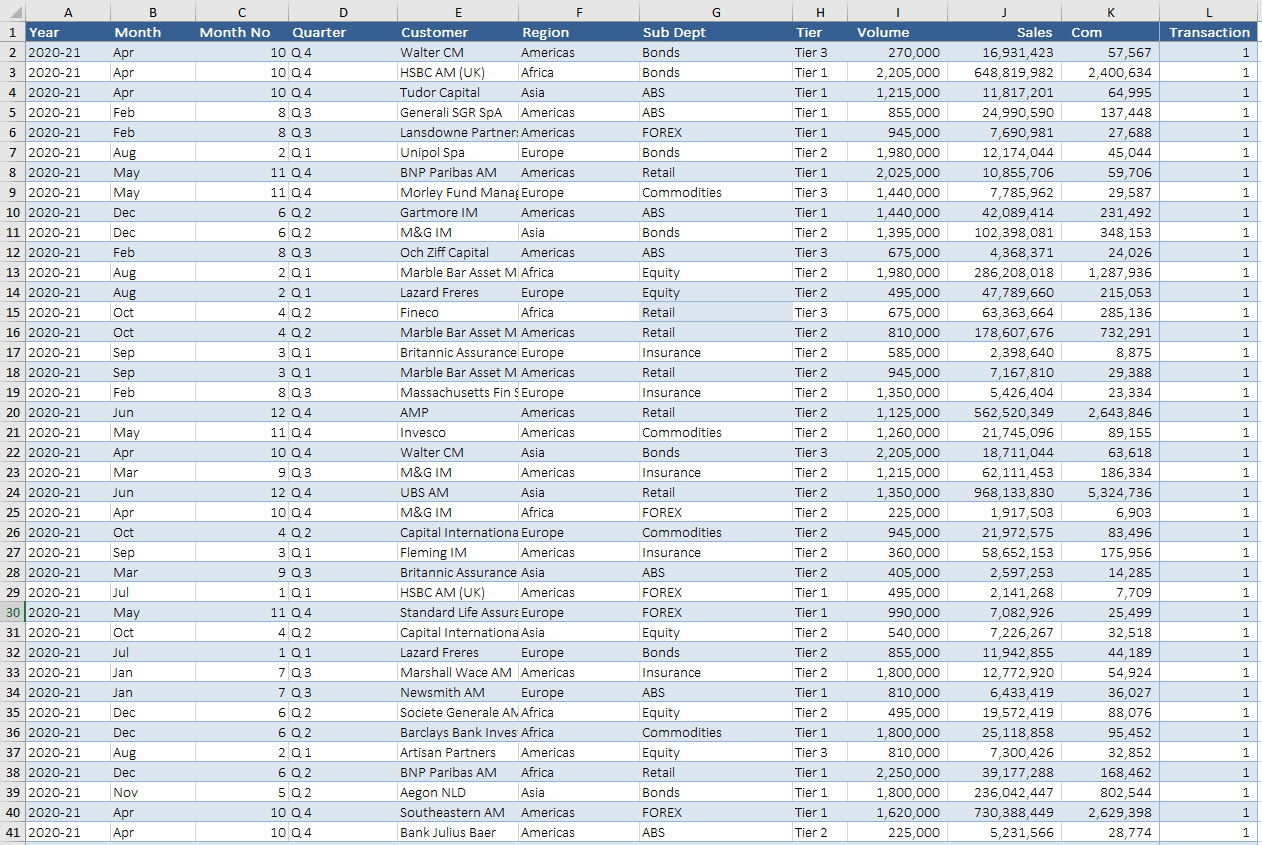
- Revenue and Commission, FTE (headcount), major project tracking.
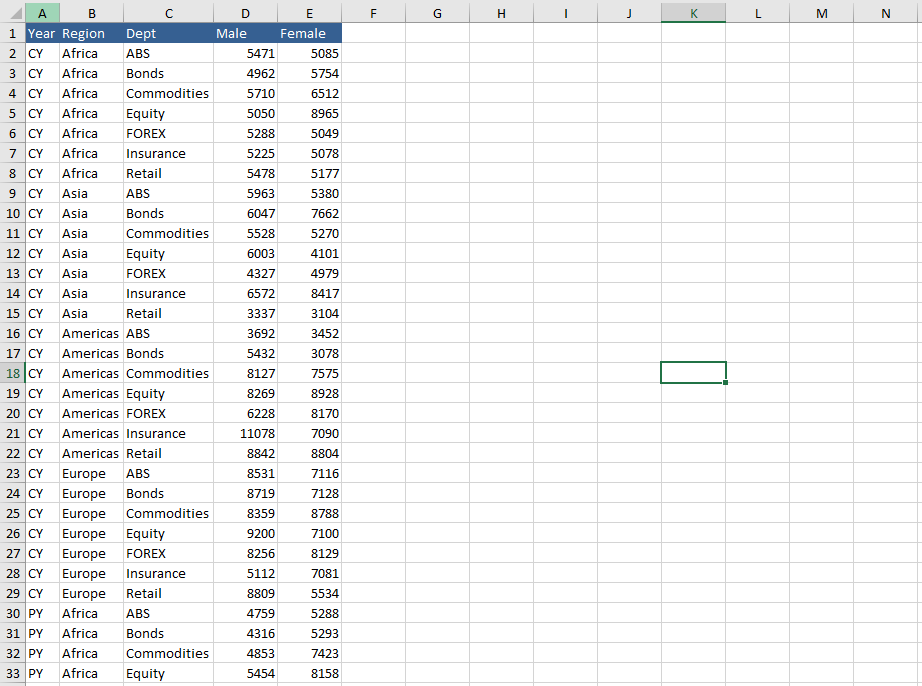
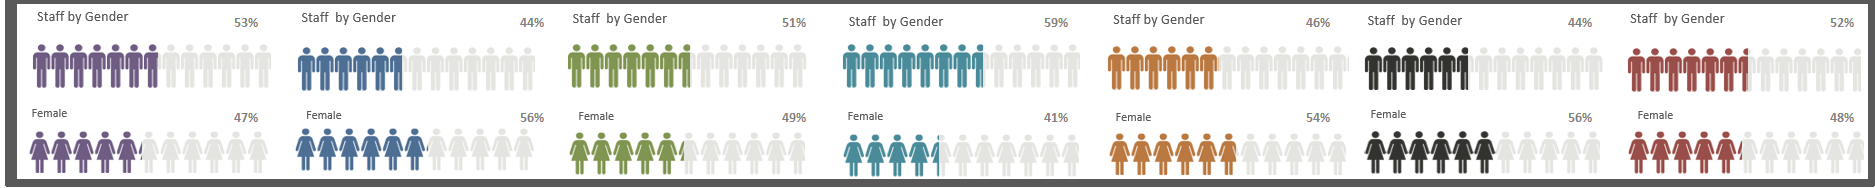
- Actual v Plan revenue and commission by department and geographic region.- Staff trained versus prior period by region.- Staff gender analysis by department and by region.
- Consultants engaged versus prior period by region.
- Sales search by origin, direct traffic, referral, organic, social media.
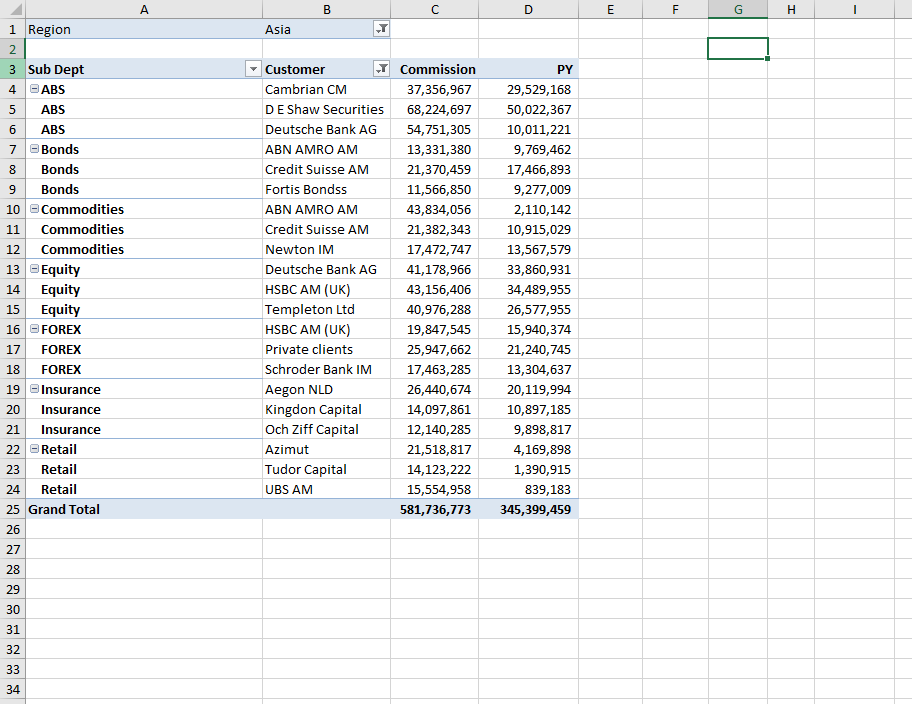
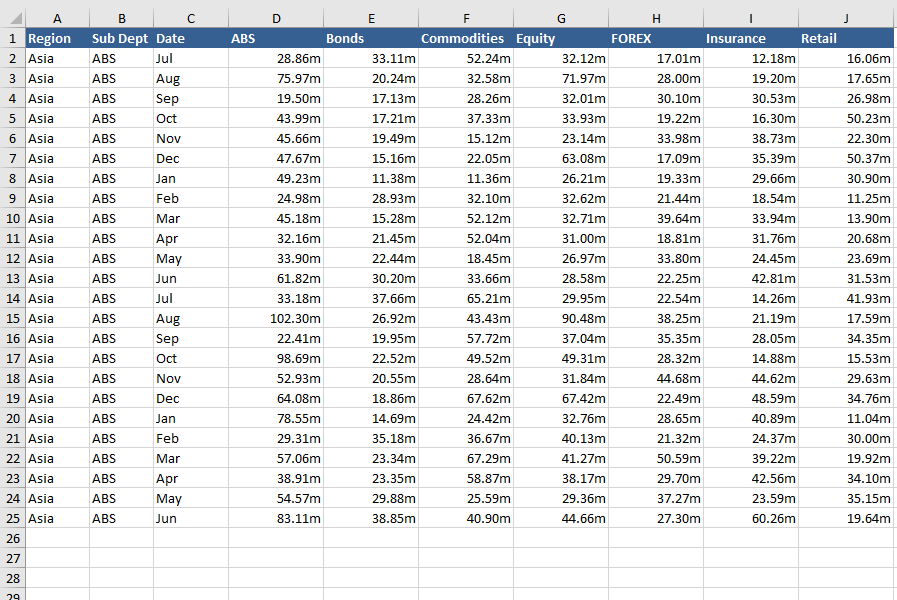
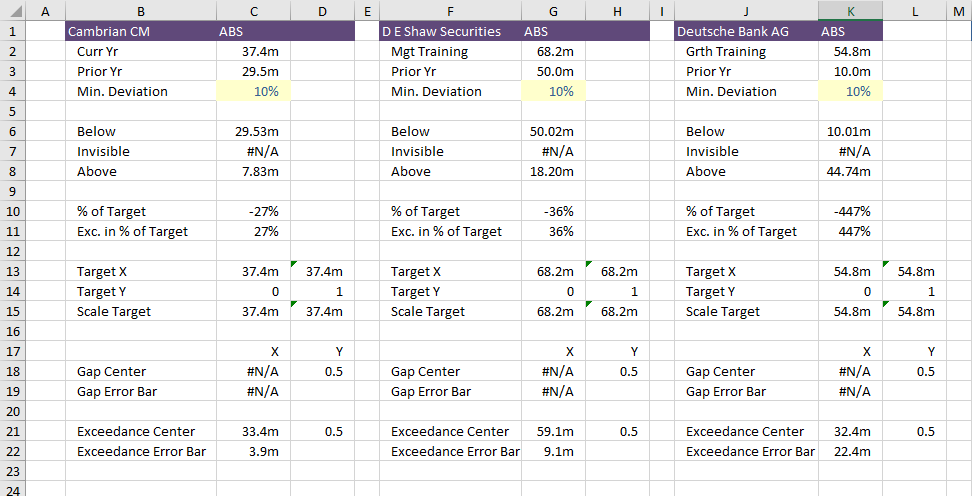
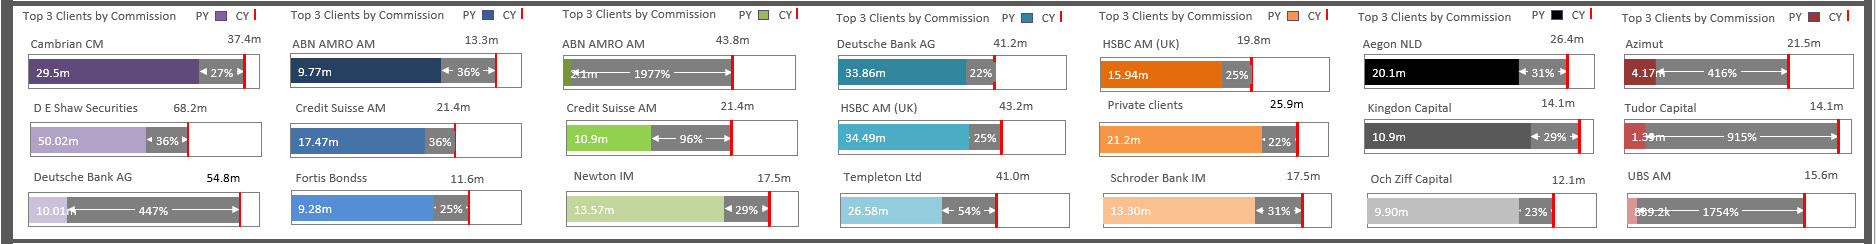
A deep dive into the revenue by client listing the top 3 clients for all 7 generating departments within the organisation producing 84 graphical displays showing key commission versus prior period.
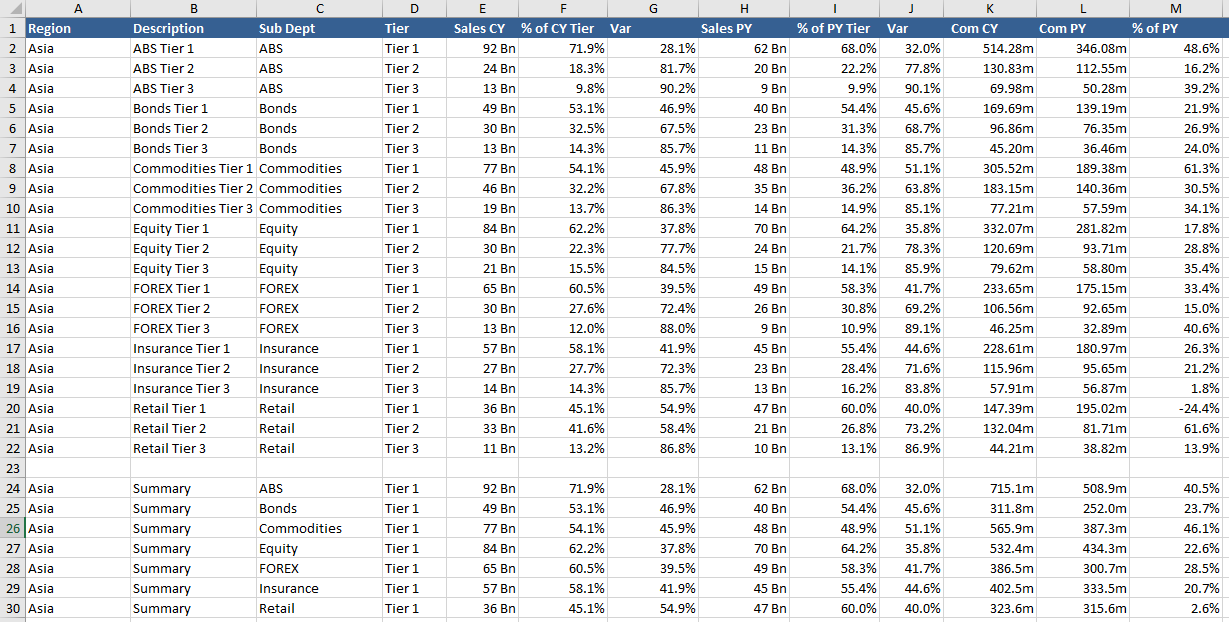
There is a logical progression for the inputting of data in order to best calculate the results of your organisation. Some spreadsheet knowledge of setup is required. If you have any questions regarding this tool, don’t hesitate to reach out by starting a discussion through private messaging.