
KPI Finance Dashboard
KPI Finance Dashboard
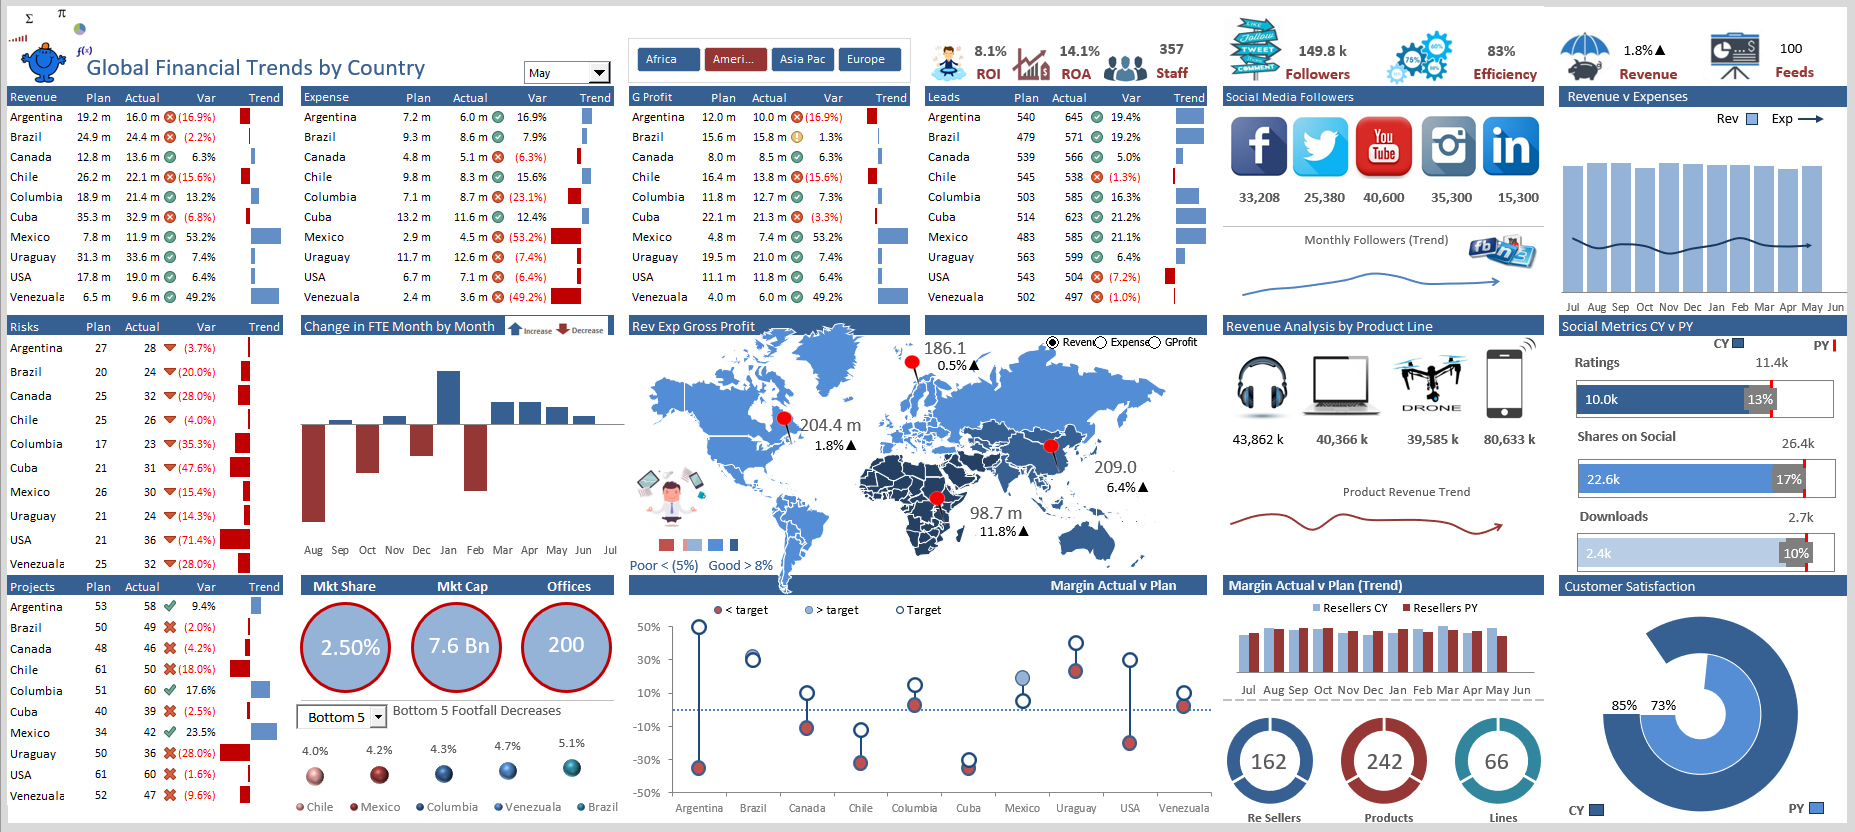
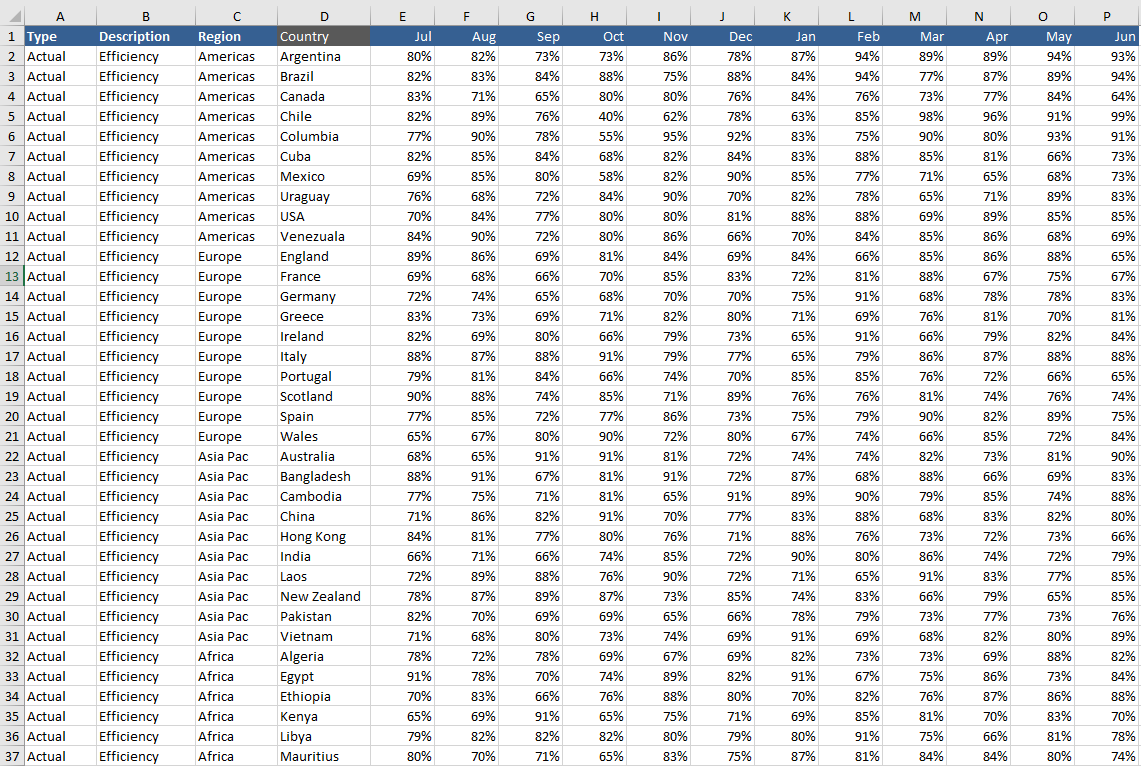
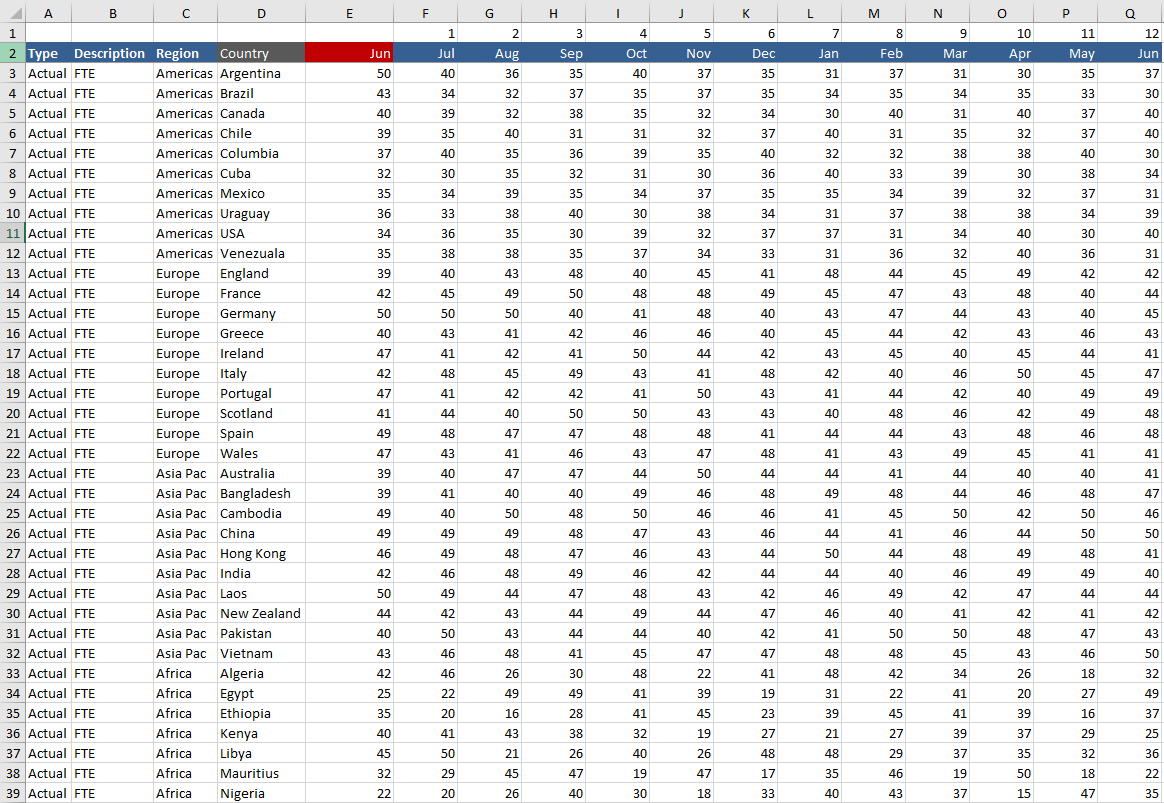
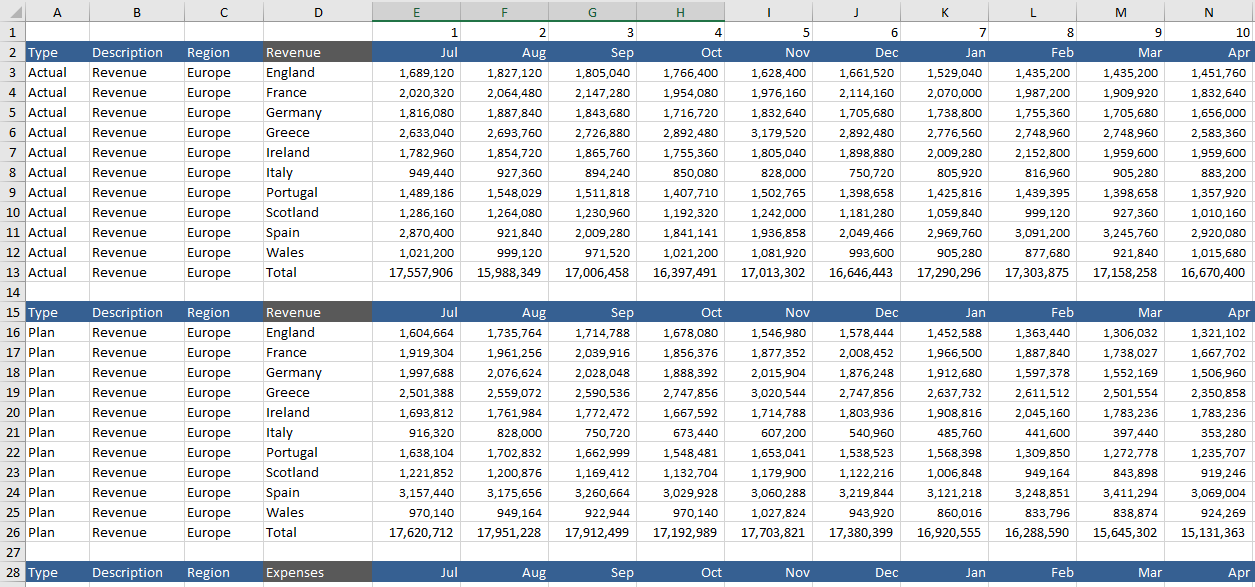
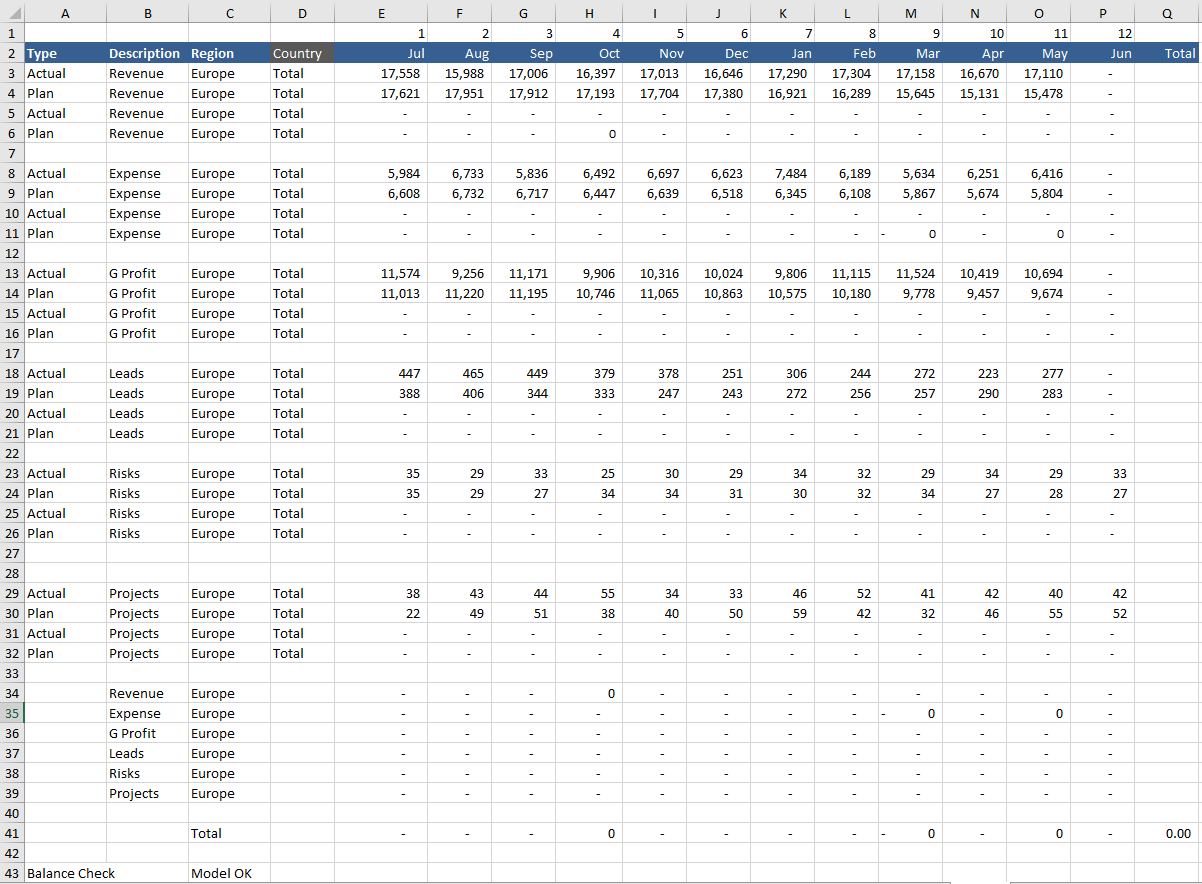
KPI financial dashboard showing key metrics revenue, expense, gross profit/loss and other operational and staffing metrics.
The dashboard has dynamism, the report can be moved forward or backwards by date. All of the charts and tables will reflect YTD as a result. The data is segregated into a logical order and summarised in a meaningful, easy to digest format.
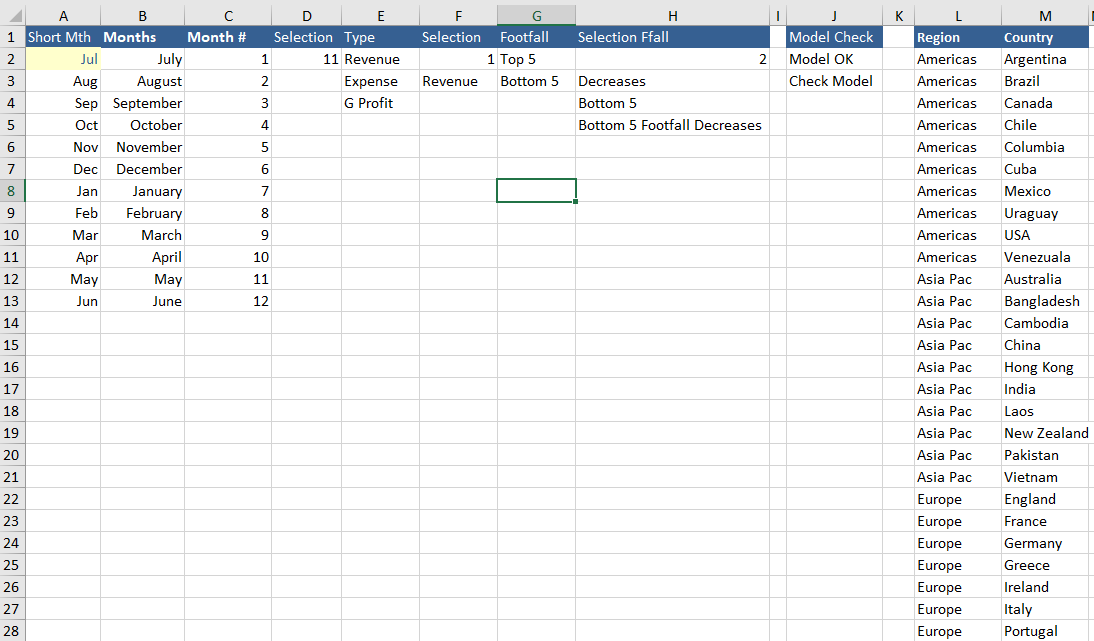
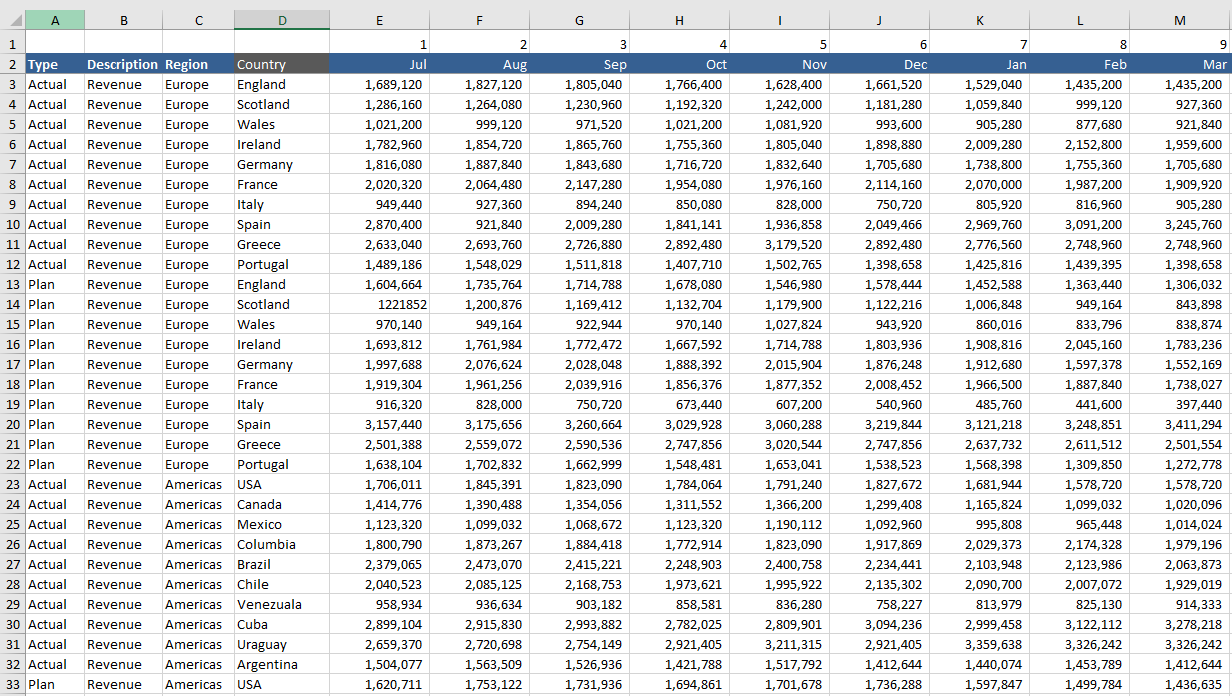
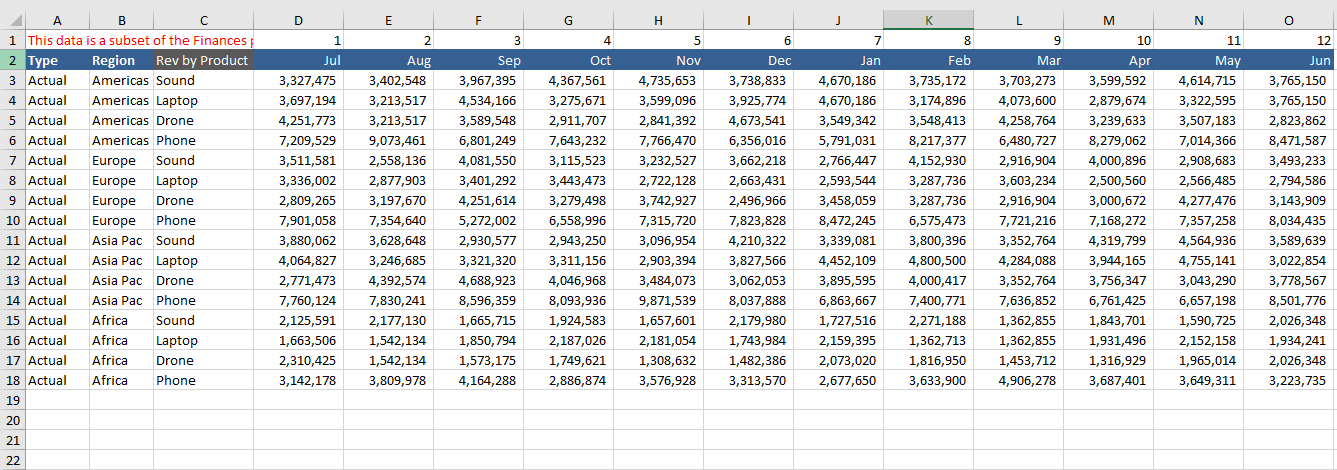
The data is structured in a logical format with the file flowing from left to right - Inputs - Calculations - Outputs. The file uses a range of tables, charts and shapes to display a compelling story. There is a variety of controls, from a combo box to control the data displayed, a range of option buttons to control the colour of the heat map and a slicer to change the focus on region. The whole file changes seamlessly as any of the metrics are altered.
Users will gain the maximum benefit from this file if they are already competent spreadsheets users. The file is designed for people who use Excel on a regular basis, and are comfortable with using its tools and functions. Incorporation of new data should be plug and play considering the calculations you wish incorporated.
If you have any questions regarding this tool, don’t hesitate to reach out by email directly.
This business tool includes
1 Excel file (14 Tabs)