
Global Sales Dashboard with Heatmap


Global Sales Dashboard with Heatmap
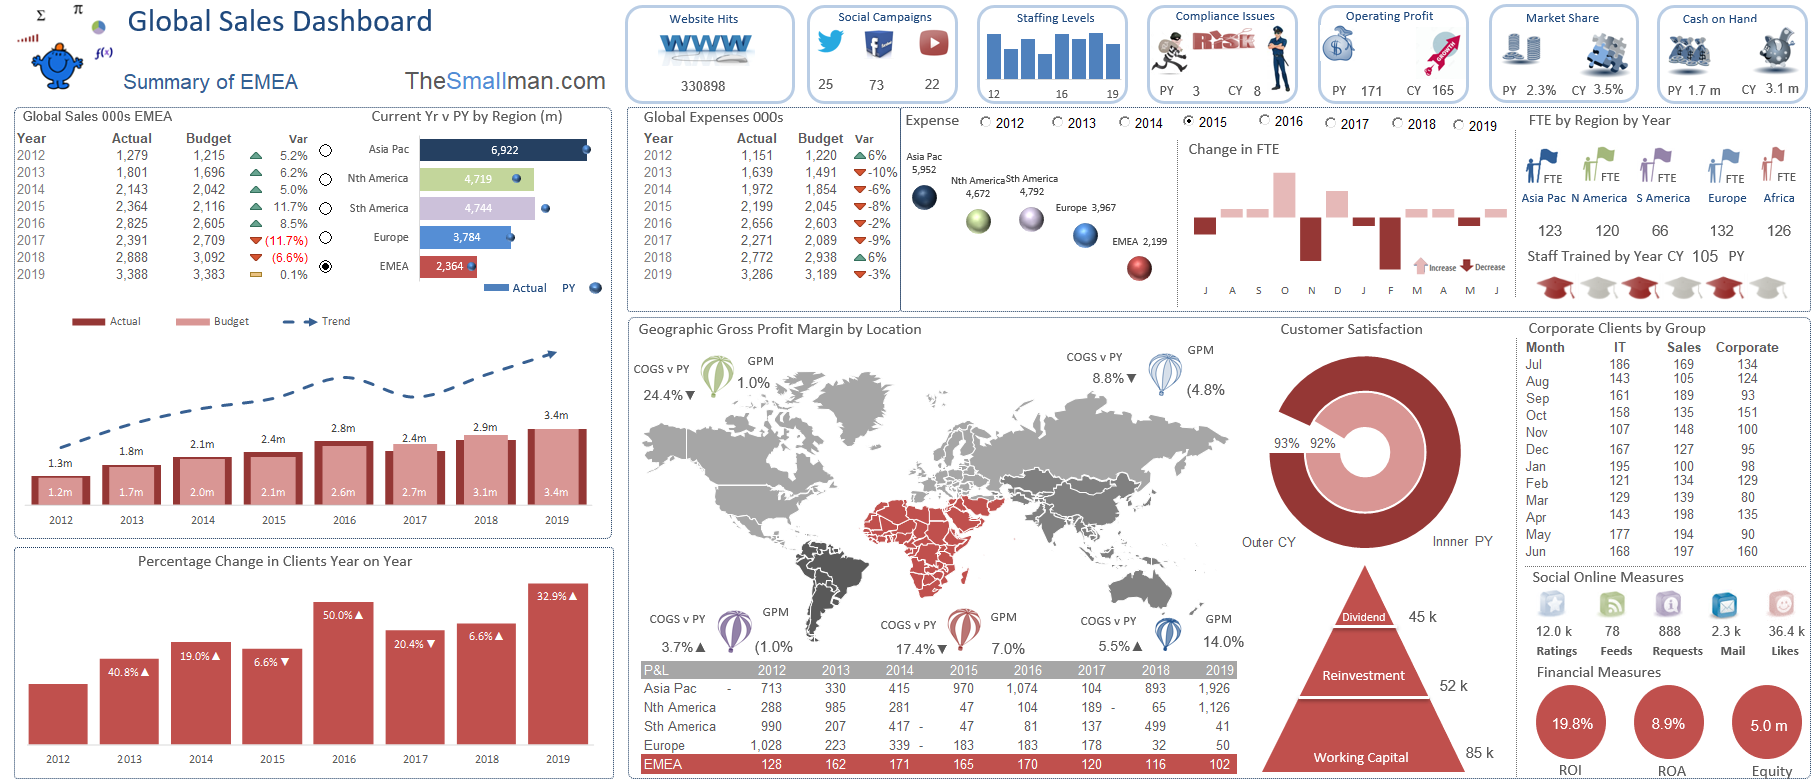
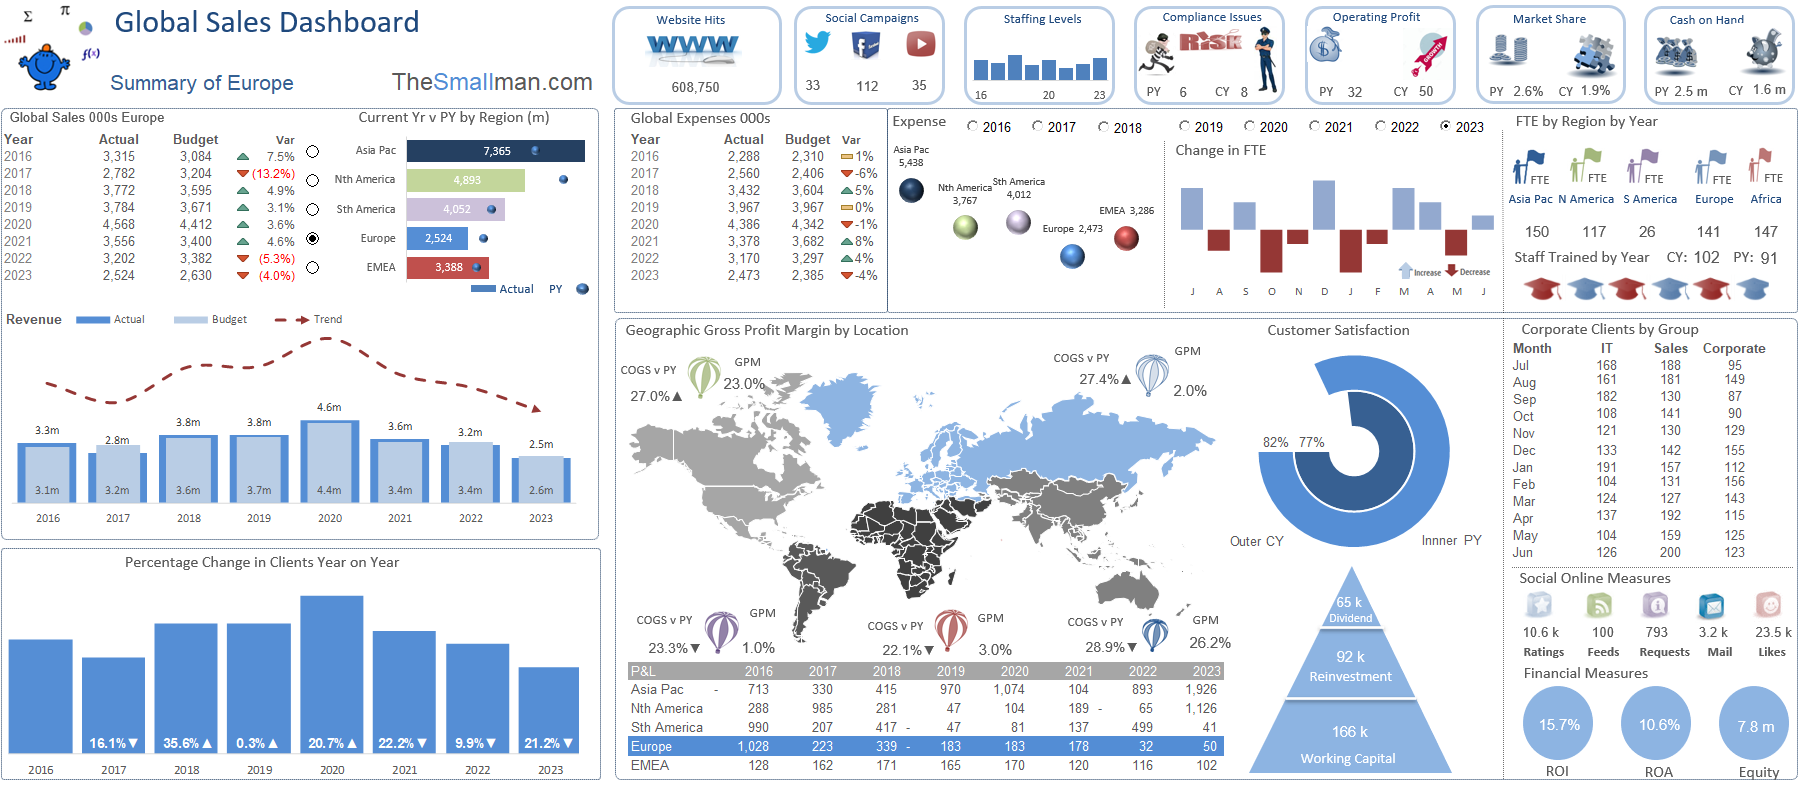
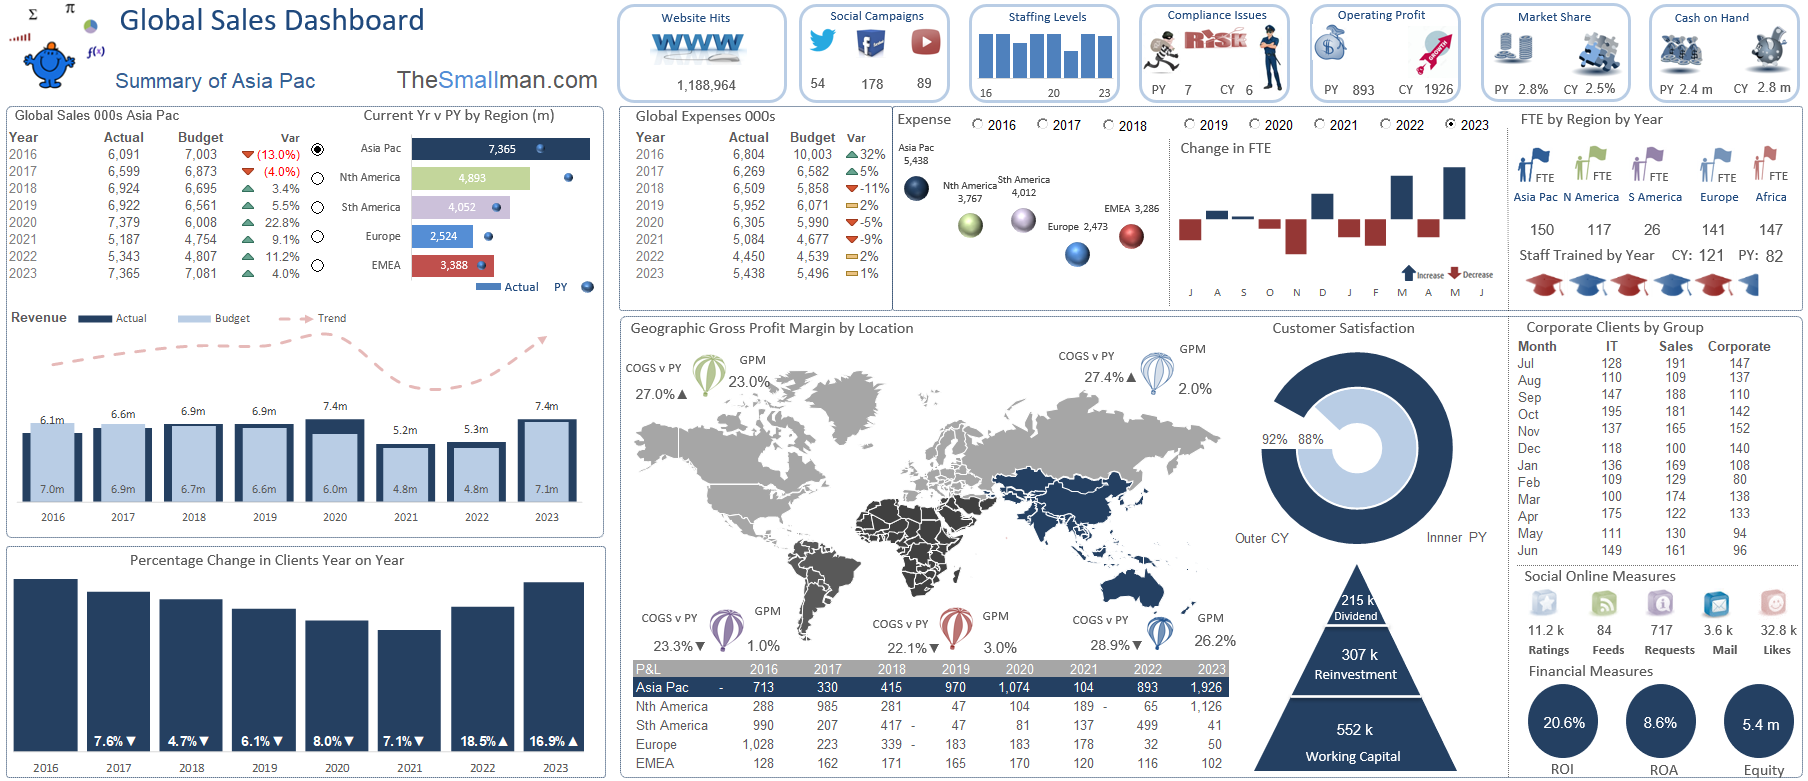
An sales dashboard displaying key metrics from around the world by month and year to date. The dashboard is flexible and takes fresh data easily.
This is a ready-to-use, instantly downloadable global sales key performance indicator dashboard for professional use.
A highly detailed, yet clear and well-presented Excel spreadsheet, this tool will help to effectively monitor and record the progress and performance of your sales team on a global level. It contains a range of metrics which are displayed in a top-level dashboard, including a geographic heat map.
The following metrics are included for manipulation and monitoring:
- Global Sales, Actual vs. Budget
- Percentage Change in Clients Year on Year
- Geographic Gross Profit Margin by Location Heat Map: This lights up when a certain region is selected. The entirety of the dashboard will change colour based on the chosen region.
- Dividend, Reinvestment, and Working Capital
- Global Expenses
- FTE by region by year
- Social Media Online Measures
- Website Hits
- Staffing Levels
- Compliance Issues
- Operating Profit
- Market Share
- Cash in hand
1 Excel File (14 Tabs)