
Key Financial Metrics Report Excel Model
Key Financial Metrics Report Excel Model
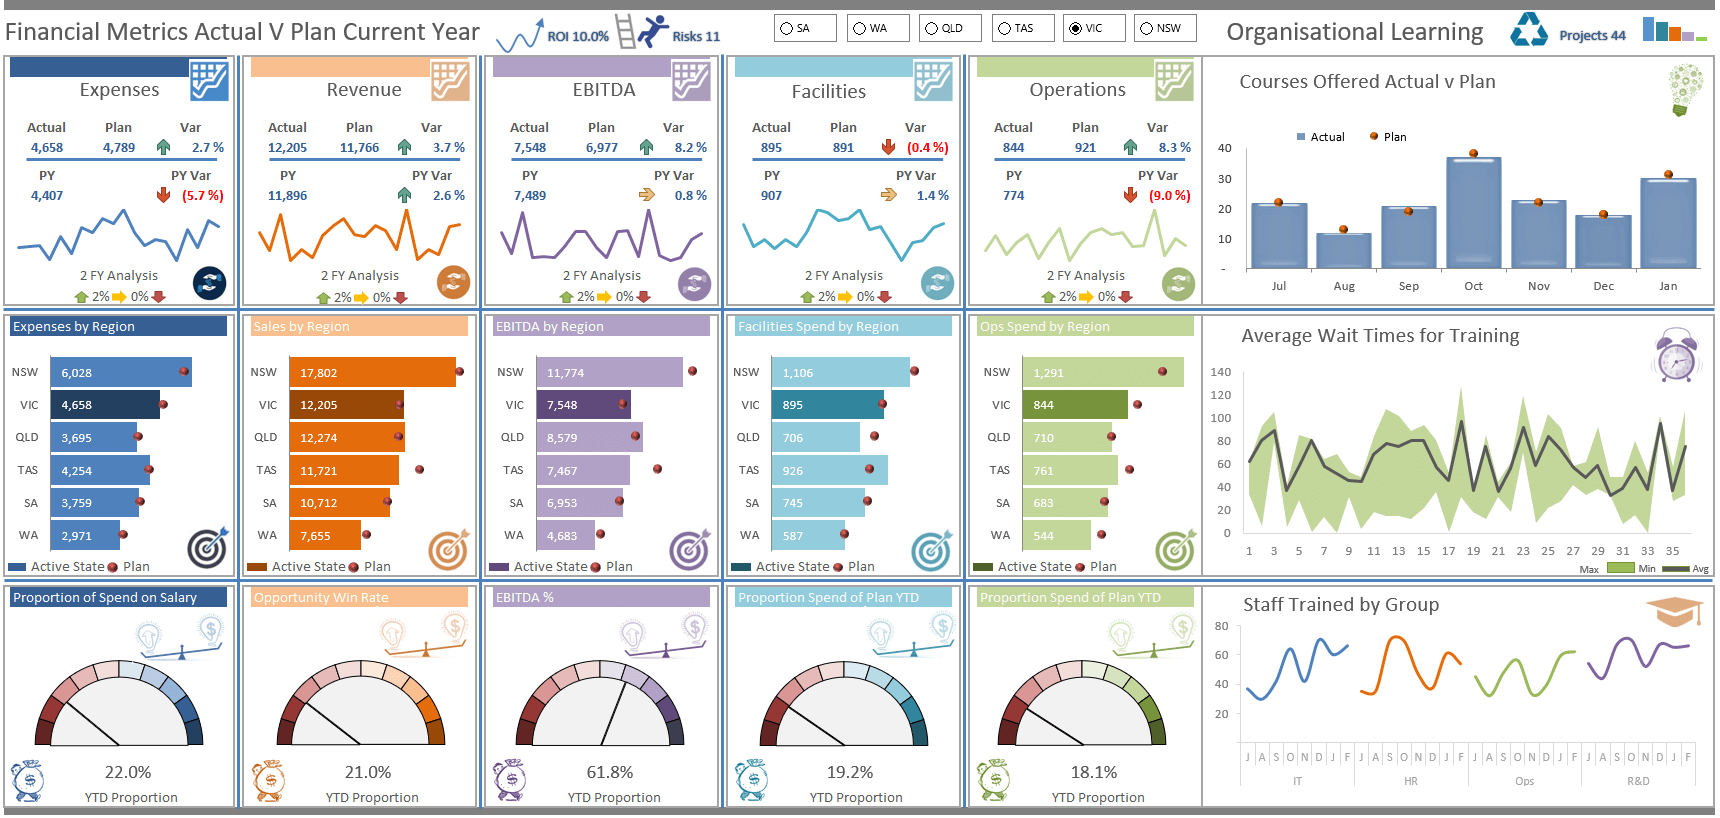
A YTD Excel dashboard model that displays key operational and staffing metrics in a single page.
Description
The file looks at a range of financial metrics, compares actual to plan to prior year and works out variances. It has a trending chart for each of the areas which looks at 24 months of data. The report uses option buttons to compare each geographic region however this could be easily changed to spin the model by department or product or operational area. Additionally the report considers training trends, ROI, risks and operational projects. There is an acute focus on revenue and expense by department and the model incorporates some innovative charting solutions in the final output.
The file has a number of training metrics which compare training actual v plan, for training events, average wait times for training and staff trained by group. As such it allows management to monitor the overall performance and see the granular details behind the training events. Equally these metrics could be changed to suit.
Users will gain the maximum benefit from this file if they are already competent spreadsheets users. The file is designed for people who use Excel on a regular basis, and are comfortable with using its tools and functions. Incorporation of new data should be plug and play considering the calculations you wish incorporated
This business tool includes
1 Excel File (12 Tabs)