
Revenue Expense and Staff Reporting Dashboard
Revenue Expense and Staff Reporting Dashboard
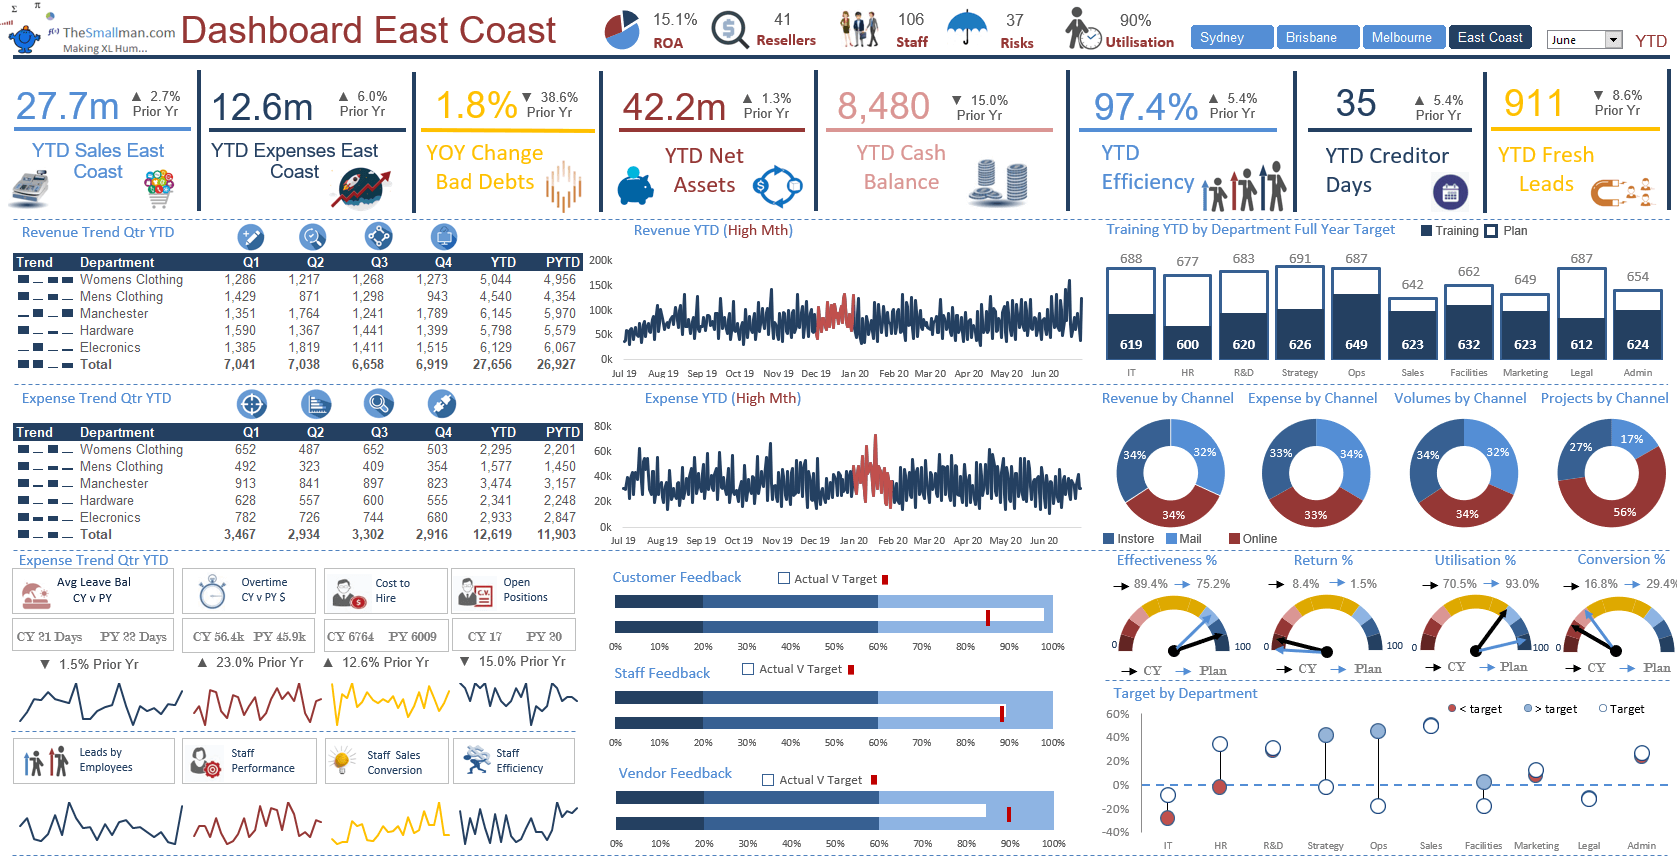
A key metrics organisational dashboard focusing on revenue and expenses.
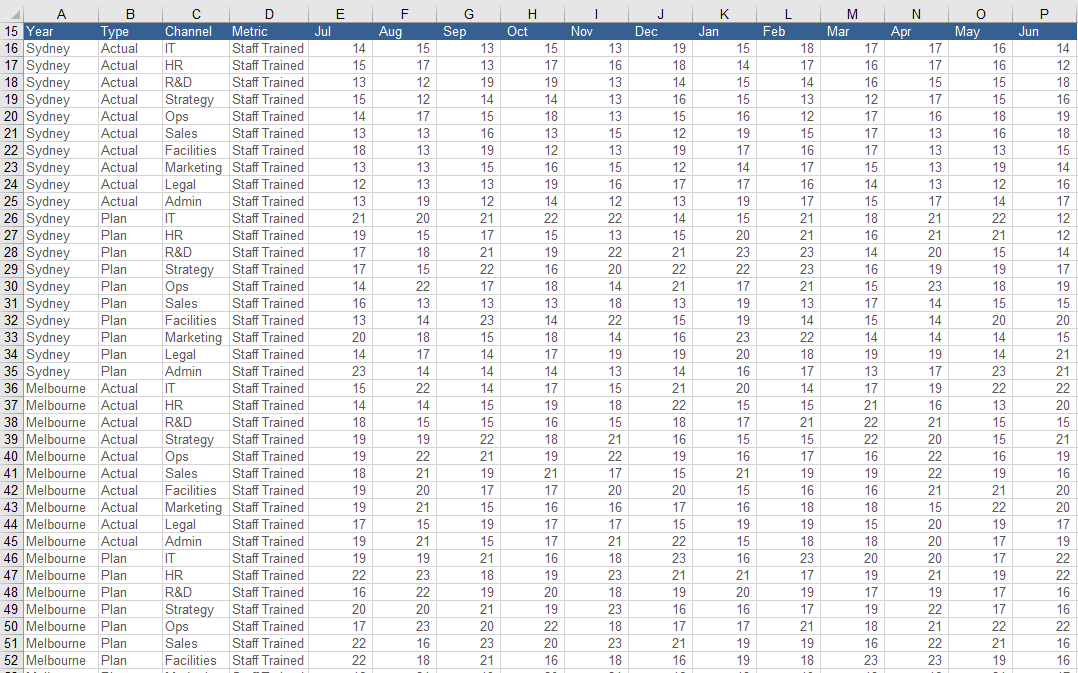
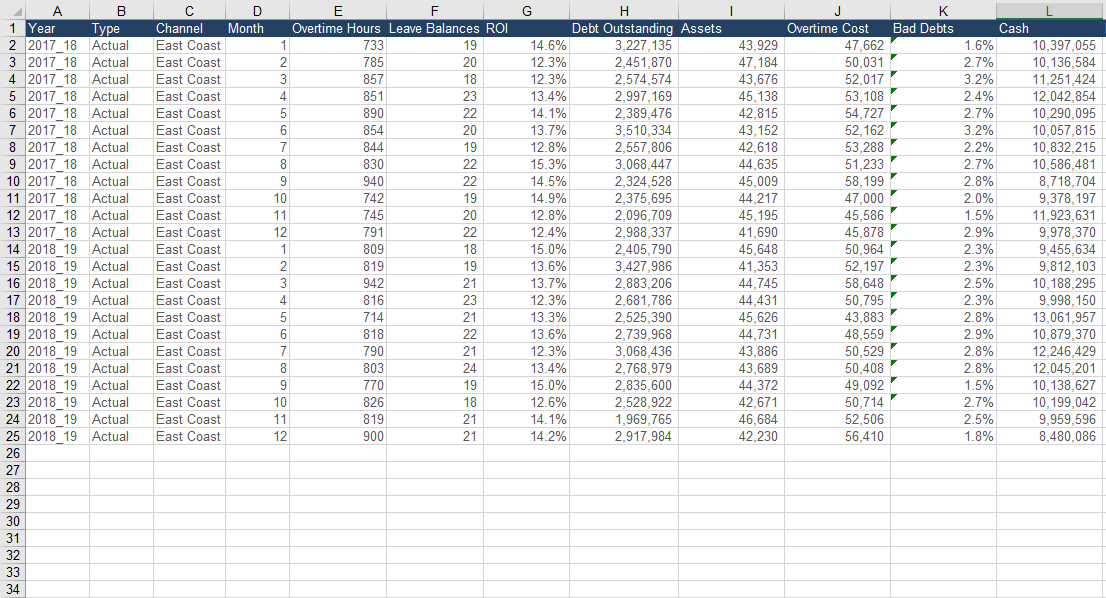
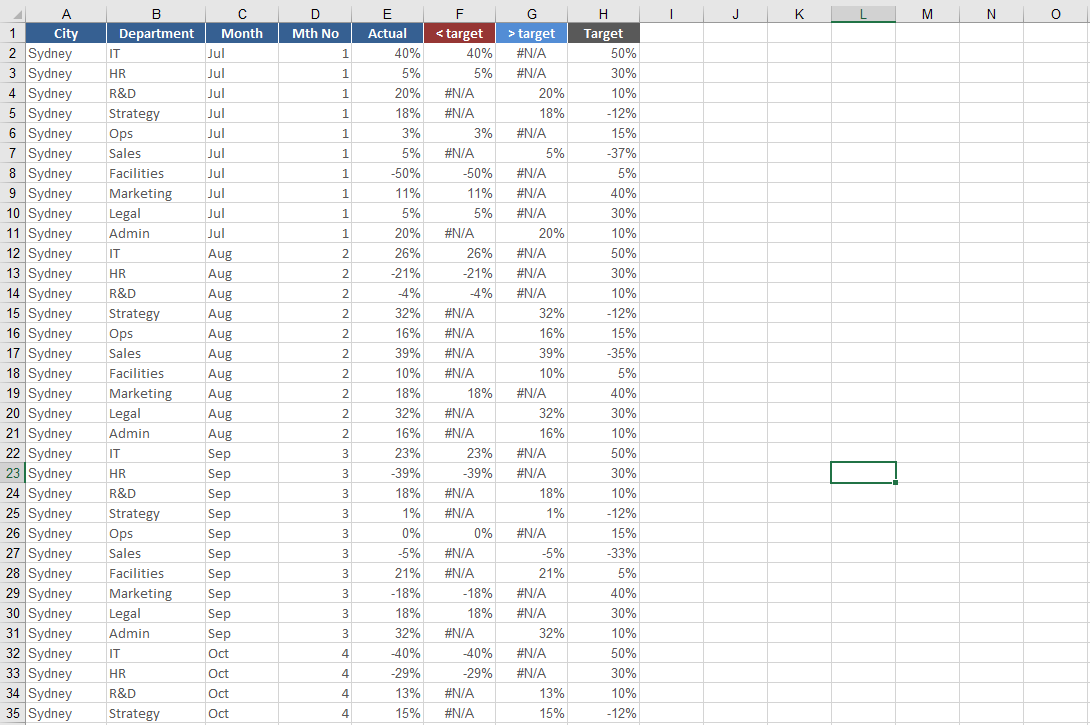
The Revenue and Expense dashboard report is clean and clear with a range of metrics including sales and expense comparisons, variance to plan, leave balances,overtime cost, ROI trends, average debtors, it has a range of historical, company specific financial data and customer and staff feedback.
The underlying data can be changed to suit a range of different metrics quickly and easily - the entire design is elegant and simple to update and this report would be a well received dashboard to any corporate environment. The report displays a range of nice infographics and has a slicer at the top to show individual parts of the organisation or the consolidation (regional).
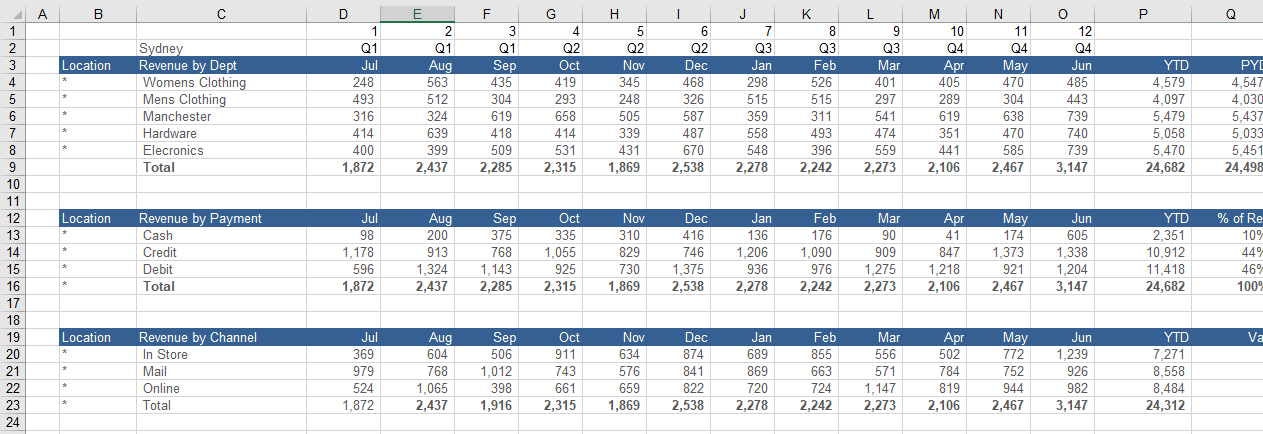
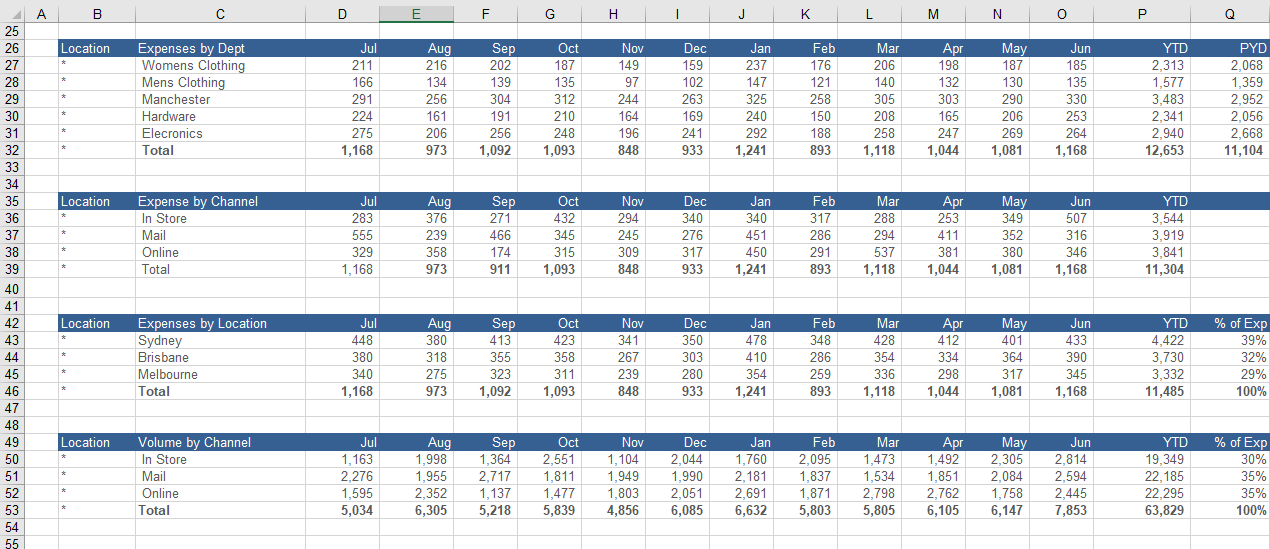
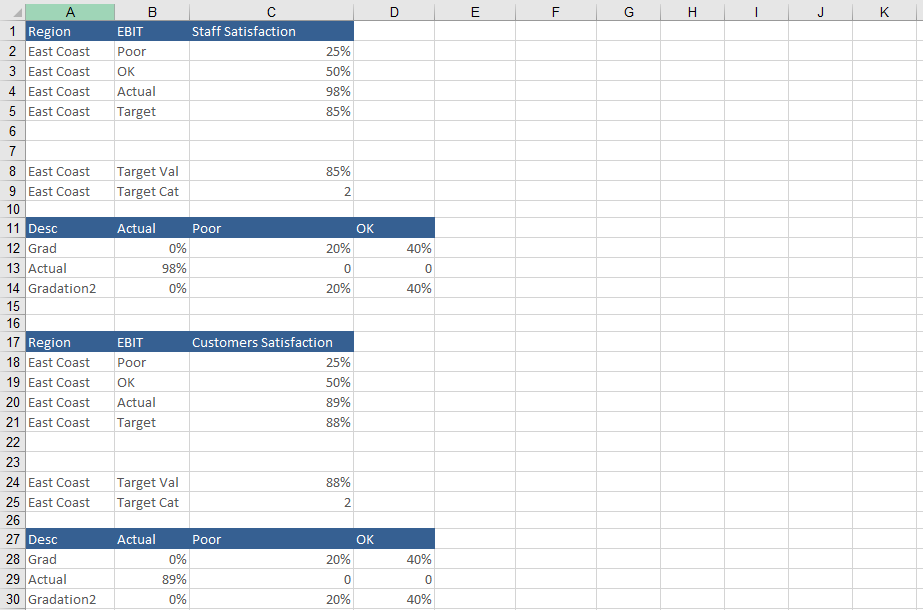
Users will gain the maximum benefit from this file if they are already competent spreadsheets users. This is an advanced dashboard. The file is designed for people who use Excel on a regular basis, and are comfortable with using its tools and functions. Incorporation of new data should be plug and play considering the calculations you wish incorporated.
This business tool includes
1 Excel file (13 tabs) all self contained