Animated Heat Map in Excel
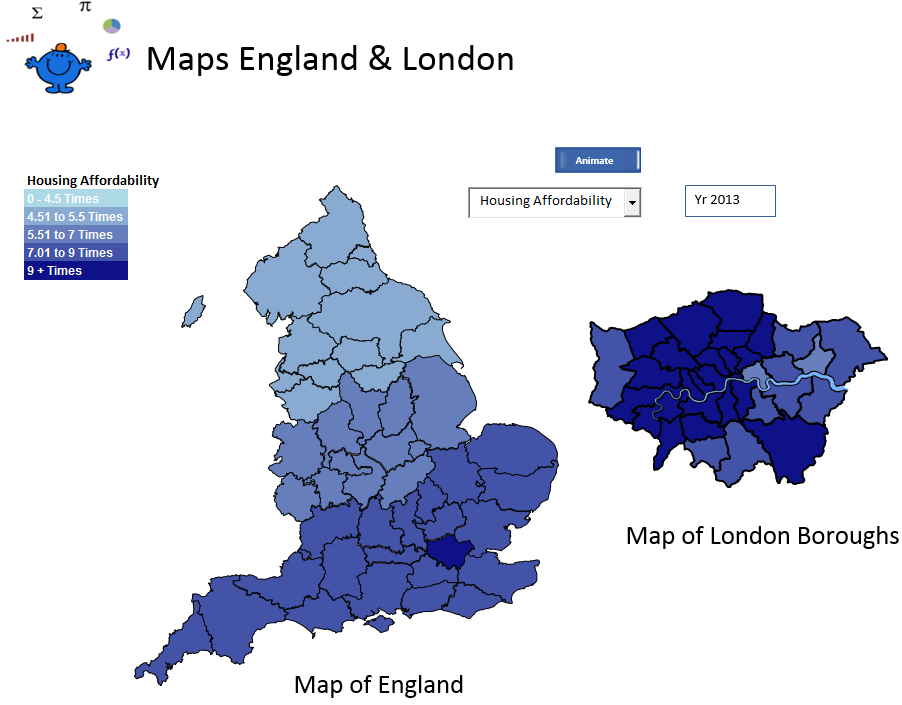
The following article is an example of how to make a meat map animate. I have created some animated charts and this is an addition to this technique. There are numerous heat maps on the site this one combines a map of the counties of England and the boroughs of London to produce heat maps on Housing Affordability, Average House Price and Income in the respective maps. The period displayed is from 1997 to 2013.
The following procedure will change a cell value and wait 1 second before moving to the next year. It actually goes from 97' to 2013. The Excel VBA coding which drives the file is as follows;
Application.Wait (Now + TimeValue("00:00:01"))
Main
The procedure called main is as follows. This procedure is mapped out more fully in the Heat Maps in Excel article.
Option Explicit
Sub Main() 'Excel VBA Drop down, Main process
Dim ar As Variant
Dim var As Variant
Dim i As Integer
Dim j As Integer
Dim n As Integer
Dim lup As Variant
Dim fn As Range
Set fn=Sheet3.Range("N2", Sheet3.Range("N" & Rows.Count).End(xlUp)).Find([b2])
Set fn=fn.Offset(, 1).Resize(5, 1)
fn.Copy [B9]
lup=[{"Income Grade 97","Multiple 97","AvgPrice 97"}]
n=Sheet2.Range("A1:CZ1").Find(lup(Sheet1.[C2])).Column + [C1]
var=Sheet3.Range("U2", Sheet3.Range("W65536").End(xlUp)) 'List Sheet
ar=Sheet2.Range("B2", Sheet2.Range("B65536").End(xlUp)) 'London Sheet
For i=1 To UBound(ar) 'Excel vba start loop
Set shp=Sheet1.Shapes(ar(i, 1))
shp.Fill.ForeColor.RGB=RGB(var(j, 1), var(j, 2), var(j, 3))
The code works by finding what variable is selected in the combo box and applying a colour scheme based on the colour codes in the List sheet. The Excel VBA and animated heat map is in the file below. The colours can be adapted to suit your needs.