Change Plot Area Colour
In the last article Change Chart Series Colour I focused on changing the colour of data points based on the colour of the cells which make up the chart data. The following article show how you can change the plot area colour. There practical implications, for example, you may wish to highlight charts which meet a condition, are below a given expectation. If a chart is showing lower than expected figures you may wish to change the chart plot area to red.
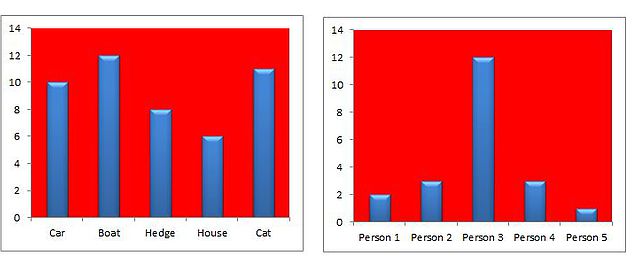
The above is an example of filling the chart area to red. The following code will make the chart area red for all of the charts in a worksheet.
Option Explicit
Sub ChangeChartFill() 'Excel VBA to make the chart fill red.
Dim str As String
Dim j As Integer
Sub ChangeChartFill() 'Excel VBA to make the chart fill red.
Dim str As String
Dim j As Integer
For j=1 To ActiveSheet.ChartObjects.Count
End Sub
str=ActiveSheet.ChartObjects(j).Name
Sheet1.ChartObjects(str).Chart.PlotArea.Format.Fill.ForeColor.RGB=RGB(255, 0, 0)
Next j
Sheet1.ChartObjects(str).Chart.PlotArea.Format.Fill.ForeColor.RGB=RGB(255, 0, 0)
While this code will change the colour back to a neutral colour.
Option Explicit
Sub ChangeBack() 'Excel vba to make chart fill normal.
Dim str As String
Dim j As Integer
Sub ChangeBack() 'Excel vba to make chart fill normal.
Dim str As String
Dim j As Integer
For j=1 To ActiveSheet.ChartObjects.Count
End Sub
str=ActiveSheet.ChartObjects(j).Name
Sheet1.ChartObjects(str).Chart.PlotArea.Format.Fill.ForeColor.RGB=RGB(255, 255, 255)
Next jSheet1.ChartObjects(str).Chart.PlotArea.Format.Fill.ForeColor.RGB=RGB(255, 255, 255)