

The dashboard tracks incidents by year and by cost. It is only a small dashboard but has stacks of functionality. The chart on the far left is achieved through a smart Excel formula called the REPT funcion. It will repeat formula a set amount of times.
If I was to write the word Car in A1 and 3 in B1, the following formula
=REPT(A1,B1)
Would produce a result as follows
CarCarCar
So this formula can be used in conjunction with webdings and wingdings. There are plenty of options in these menus to add relevant pictures. Try it for yourself.

The dashboard also uses a useful technique outlined in my previous blog post.
Excel VBA Slicer Selection
It uses VBA to trap the clicking of the slicer (actually it traps a change in the pivot table the slicer is linked to). So as new year is clicked both chart 1 and chart 3 (far left and far right charts) are sorted in descending order. This is done for visual effect.
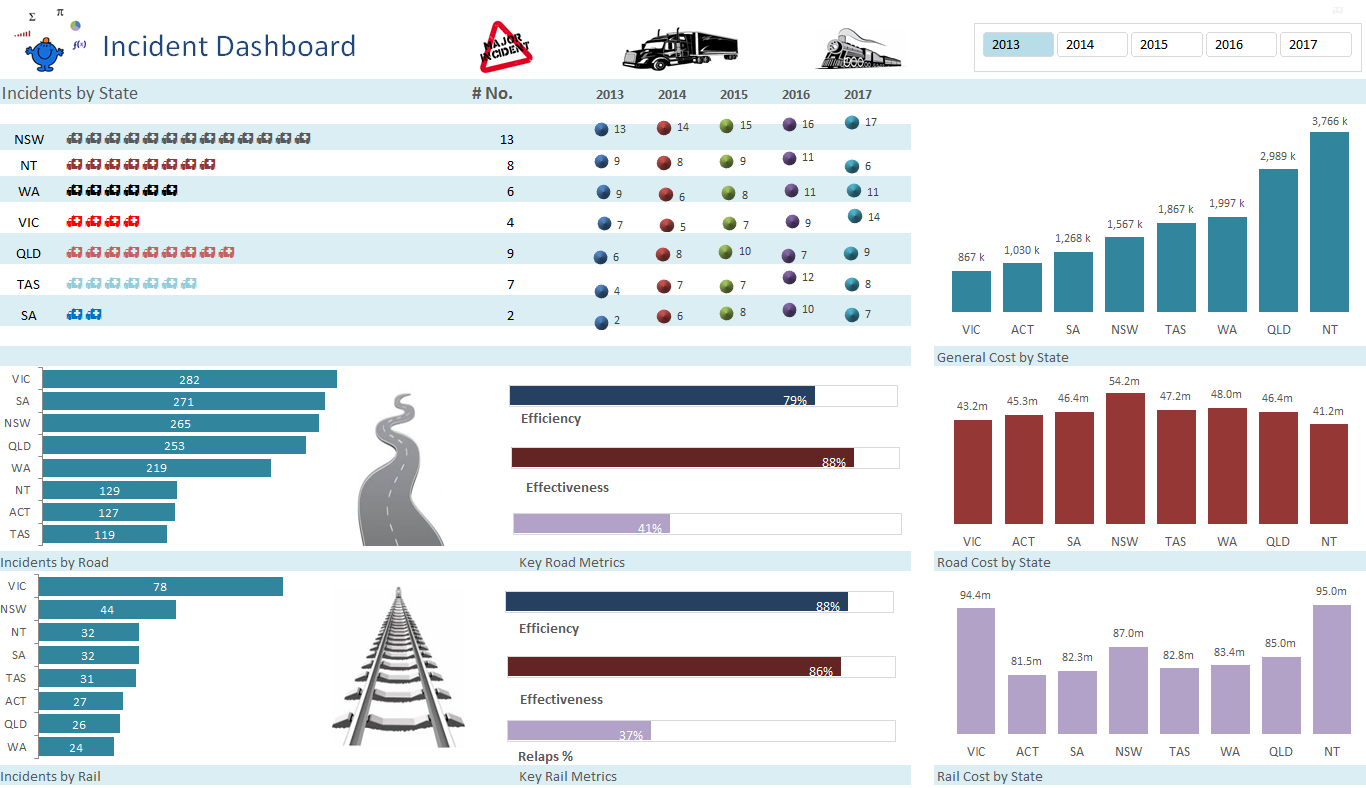
This is the final output for the attached Excel workbook.


