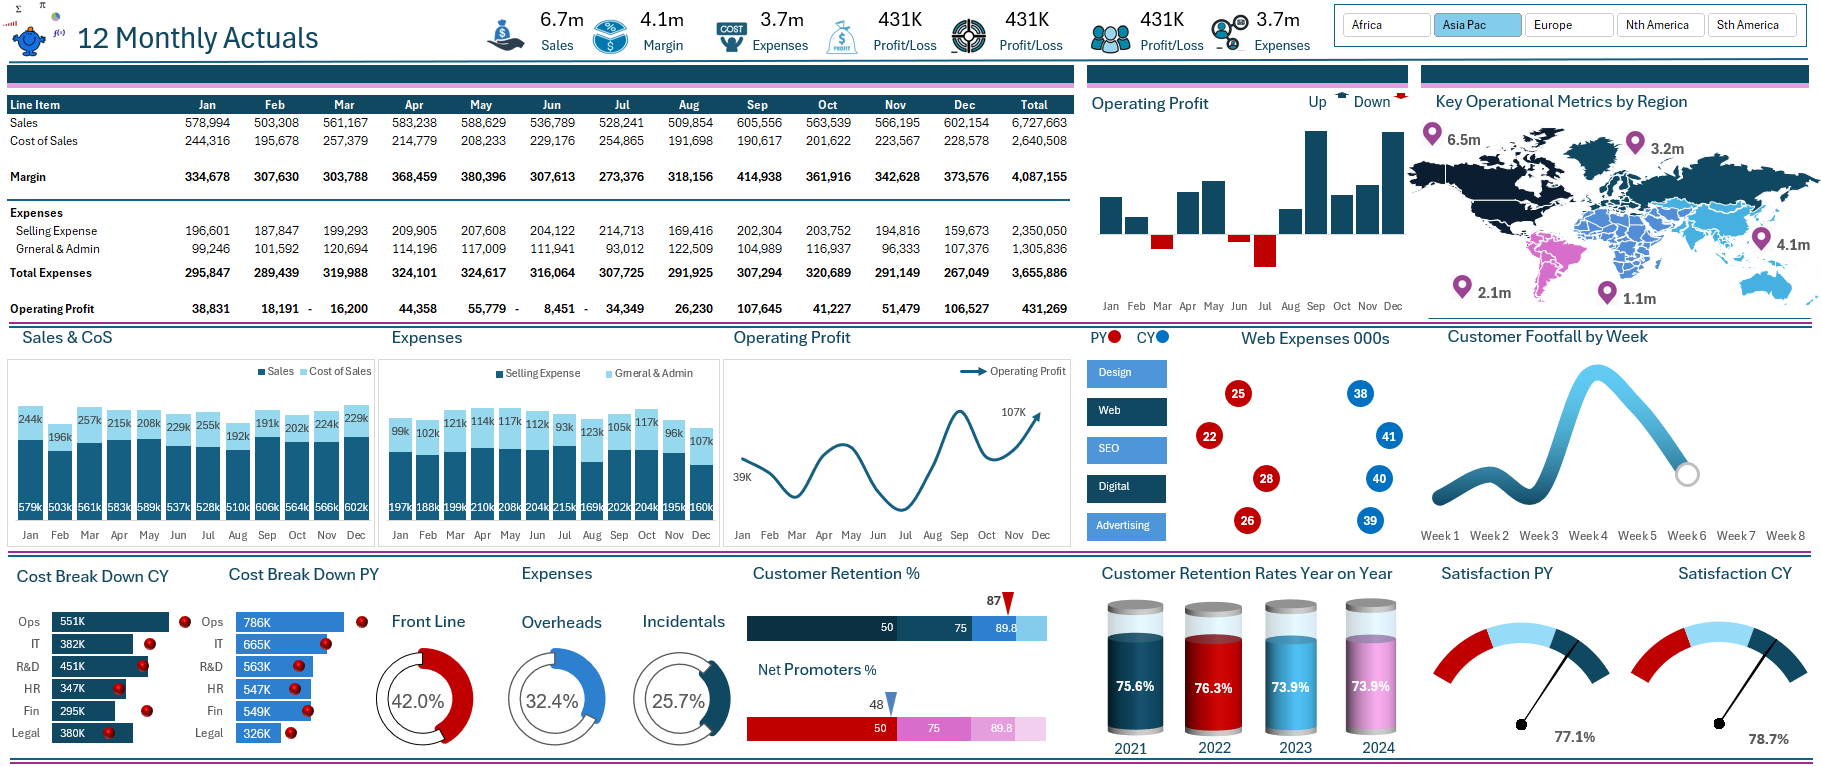
Understanding the Fuzzy Distribution Excel Formula for Random Data Generation
Quite often I have to generate a random list of numbers but want them to be more random than the randbetween function.
In data modeling and simulation, especially when working with mockups or testing data-driven applications, it’s often necessary to create realistic yet randomized datasets. A useful technique in Excel for this purpose is fuzzy distribution, which allows you to generate data that simulates non-uniform distributions — meaning, not all values have an equal chance of being selected. A practical implementation of this technique is through the following Excel formula:
=LOOKUP(RANDBETWEEN(1,100), {1,13,36,56,72,101}, {1,2,3,4,5,6})
This formula blends randomness with control, offering a powerful way to simulate real-world data distributions.
How the Formula Works
Let’s break the formula down:
RANDBETWEEN(1,100)generates a random integer between 1 and 100. This acts as the random input to drive the distribution.LOOKUP()searches for this random number in the array{1,13,36,56,72,101}and returns the corresponding value from{1,2,3,4,5,6}.
These paired arrays represent value thresholds and associated outputs:
RangeOutput1–12113–35236–55356–71472–1005(overflow)6
The output values are not evenly distributed — lower values like 1 and 2 have a smaller range (12% and 23%, respectively), while higher values like 5 have a larger range (29%). This mimics real-world scenarios where certain outcomes are more likely than others — a key feature of fuzzy distribution.
Benefits for Creating Random Data Lists
Controlled Randomness
UnlikeRAND()orRANDBETWEEN()alone, which produce uniformly distributed values, this method lets you simulate weighted randomness. You can assign different probabilities to different categories, which is especially useful for realistic data simulation.Customization and Scalability
The threshold arrays can be adjusted to fine-tune the probability of each output. You could easily simulate skewed data, normal-like distributions, or any other pattern by tweaking the cutoffs and output values.Ease of Use in Excel
No complex VBA or third-party tools are required — just native functions. This makes the method accessible to analysts and developers without coding backgrounds.
Applications in Dummy Dataset Generation
Creating dummy datasets is critical when developing or testing systems before live data is available. Fuzzy distribution helps by:
Simulating Customer Segments: Assign demographic categories like age groups, income brackets, or user types (e.g., free vs. premium users) based on realistic distributions.
Mimicking Event Frequencies: For time-based or behavioral simulations (like purchases or logins), this formula can generate plausible frequency patterns.
Populating Lookup Tables: Assign product categories, job roles, or response ratings with varied probabilities that reflect real usage trends.
For example, in a dummy dataset for survey results, you might want to simulate the likelihood of receiving ratings from 1 (very poor) to 5 (excellent), with most users choosing 4 or 5. The fuzzy distribution formula allows you to replicate that skew.
Conclusion
The fuzzy distribution formula using LOOKUP and RANDBETWEEN in Excel is a simple yet powerful way to generate random but realistically distributed data. It offers a significant advantage for analysts and developers working with dummy datasets, enabling them to simulate nuanced scenarios without complex tools. Whether you're stress-testing an application or preparing sample dashboards, this approach can make your fake data feel far more real.


