
I joined a freelance website and saw that one of the companies had put raw data on the site to test the market. I took the raw data, modified it so it was anonymised and created a dashboard reeport a couple of hours late. I went to bed woke up the next day and when I went to send the reprot to the client the posting had disappearsed. Their loss is your gain. I enhanced the daashboard added a heat map and completed it nicely. The final result is as follows.
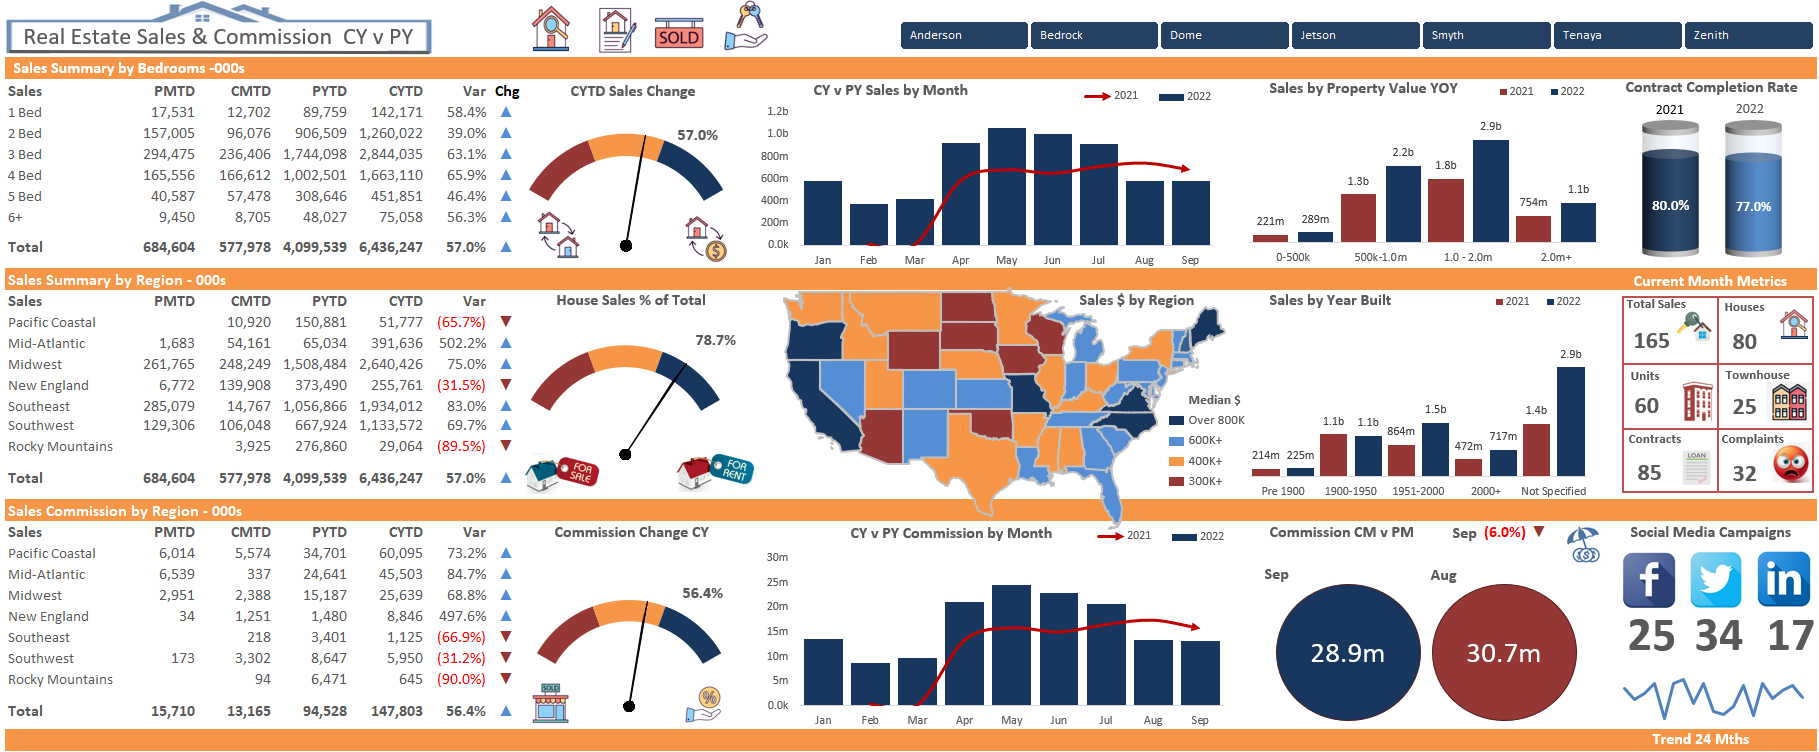
As the report is made entirely from Pivot tables it allows the entire report to move and change with the changing of the slicer. Regions can be grouped together and this will be reflected in the charts and the tables of the report. It is a nice neat and succinct dashboard that I will make a video about and share here on this page.


