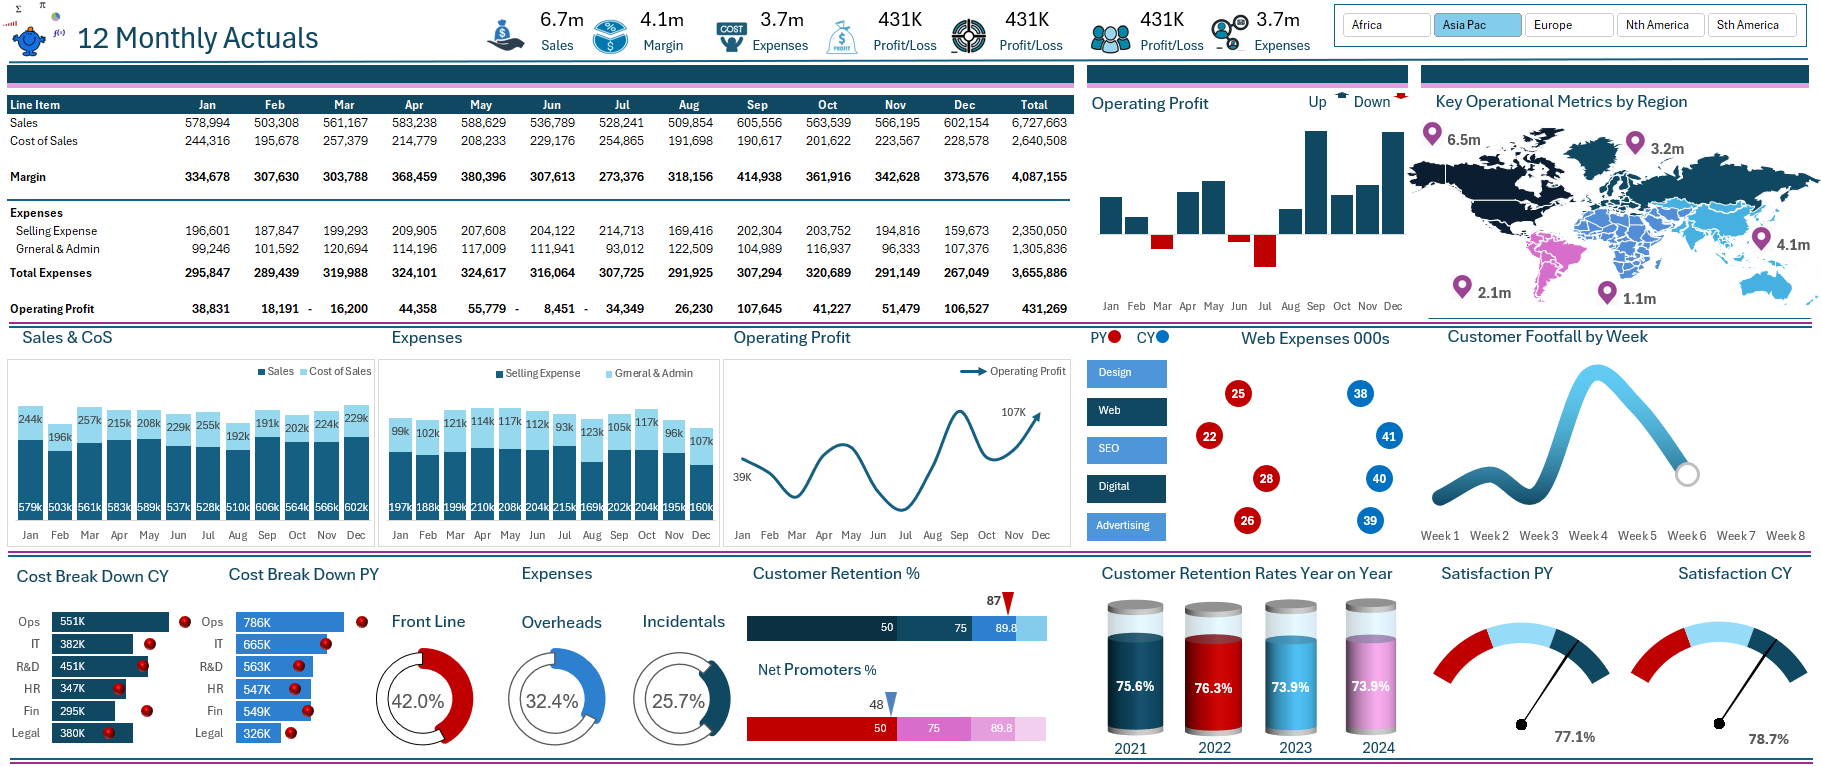
When utilizing charts in Excel, it is frequently beneficial to manage the axis scale—particularly the minimum and maximum values—to enhance clarity or highlight significant data trends. Although Excel permits users to manually modify these limits via the chart formatting options, it lacks a built-in method to dynamically link axis boundaries to worksheet cells. This limitation can be quite frustrating when the goal is for charts to automatically adjust in response to fluctuating data or user inputs.
Fortunately, with a small amount of VBA (Visual Basic for Applications) code, this process can be automated. By referencing specific worksheet cells, you can configure your charts to instantly modify their vertical (Y-axis) minimum and maximum values whenever those cell values are altered. This feature is especially advantageous for interactive dashboards or reports where data scales change over time or based on user selection.
Below, I will demonstrate a straightforward macro that retrieves minimum and maximum values from two cells and applies them to a chart’s Y-axis. Additionally, we will illustrate how to enhance this with a worksheet event, ensuring that the chart updates automatically when the input values are modified. This method provides greater control over your visualizations, making your charts significantly more dynamic and user-friendly. In the macro the min is in cell F1 and the max is in Cell F2. Remember that when adapting it to your own scenario.
Sub SetChartAxisLimitsFromCells()
    Dim cht As ChartObject
    Dim ws As Worksheet

    Set ws = Sheet1 ' Adjust to your sheet name
    Set cht = ws.ChartObjects("Chart 1") ' Adjust to your chart name

    With cht.Chart.Axes(xlValue)
        .MinimumScale = ws.[F1].Value
        .MaximumScale = ws.[F2].Value
    End With
End Sub
If you want the chart to update automatically when the values in F1 or F2 change, use this code in the worksheet’s code module:
Private Sub Worksheet_Change(ByVal Target As Range)
    If Not Intersect(Target, [F1:F2]) Is Nothing Then
       SetChartAxis
    End If
End Sub
The above demonstrates how to dynamically control a chart’s Y-axis minimum and maximum values in Excel by linking them to specific worksheet cells. Since Excel doesn’t support this functionality directly through the user interface, we used a simple VBA macro to programmatically read the min and max values from cells and apply them to the chart. We also explored how to automate this behavior using a worksheet change event, ensuring the chart updates whenever those cell values are modified. This technique enhances interactivity and makes your charts more responsive to changing data or user-defined parameters.
The following is a working version of the file. Enjoy.


