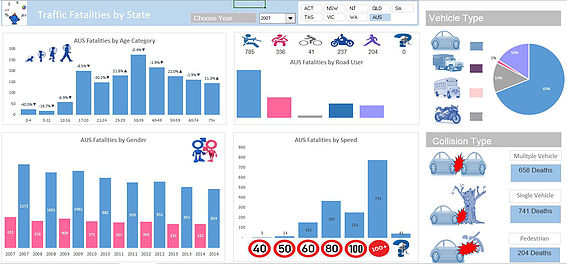
While going through some road traffic information on the Department of Transport's website it occurred to me that the data was perfect to create a dashboard. It was information rich and there were very little gaps in the data. I decided to use quite a few pictures in conjunction with the charts to try and spice them up. I have used actual data but had to ‘normalise’ some of the data as there were a few gaps.
I find it curious that someone can pass on in an accident and there would ever be a situation where age or gender would be information which was not gathered. So I have filled those gaps minor as they were. There is 15 years’ worth of data but the dashboard shows 14 years as I need I year for comparison. In case someone choses the year 2000 and I have not got 1999 for example. I believe this analysis could have gone back a further 20 years. So if anyone is doing some analysis on road statistics this would be a starting point.
I have picked out information I think is most relevant. Apart from gender the dashboard is only set up to summarise a single year at a time. Perhaps my next project would be to set up a dashboard which shows multiple states by multiple years.
For a listing of all Excel Dashboards on the Smallman.com visit this link. There are more Excel files than you will be able to view!!