Excel

TheSmallman.com

an XL ideas Lab

Dashboards VBA
  • Home
  • Dashboards
    • Tips & Tricks
    • Charts
    • Modelling
    • Infographics
    • VBA
  • Shop Dashboards
    • Power Pivot a User Guide
    • Excel Dashboard Course
    • Advanced Dashboard Course
    • Financial Modelling Course
    • Excel VBA Course
  • Blog
  • About
Menu

Excel Dashboards VBA

Street Address
City, State, Zip
Phone Number
an XL ideas Lab

Your Custom Text Here

Excel Dashboards VBA

  • Home
  • Dashboards
  • Excel Tips
    • Tips & Tricks
    • Charts
    • Modelling
    • Infographics
    • VBA
  • Shop Dashboards
  • PowerPivot
    • Power Pivot a User Guide
  • Courses
    • Excel Dashboard Course
    • Advanced Dashboard Course
    • Financial Modelling Course
    • Excel VBA Course
  • Blog
  • About

Scandinavian Infograpic in Excel

May 30, 2016 Marcus Small

Scandinavian Infographic in Excel

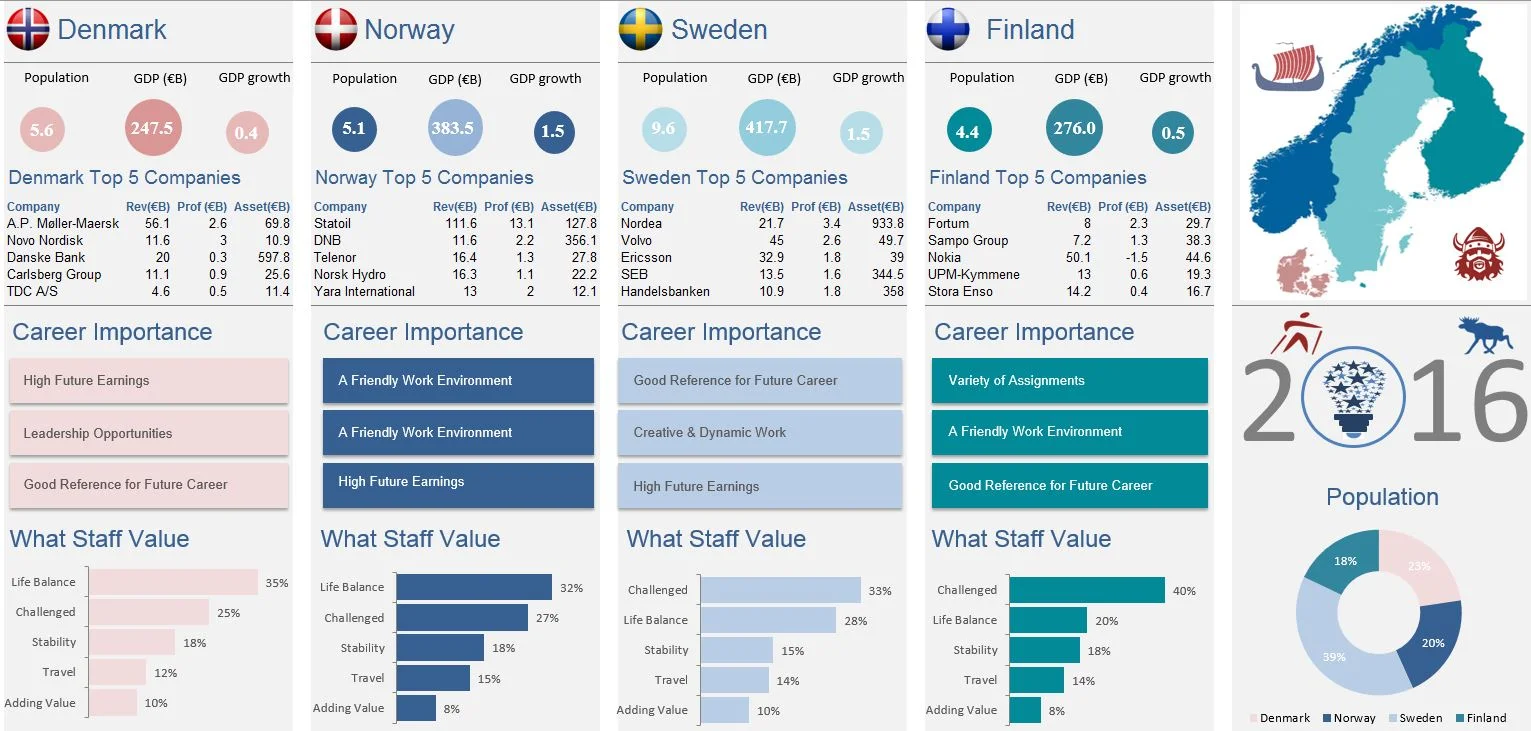
The above infographic is one of my favourites of the Nordic region. It is very simple and yet tells a story about 4 countries in Scandinavia. The Excel infographic has the top 5 companies for each country (Iceland is excluded due to its small size - sorry). It has data on career and staffing data. There is some population metrics, GDP and GDP Growth which is low all around the world as a result of the global downturn after 2008. Let's hope that ends soon.

There is a map of the Scandinavian region on the far right and the colour of the map is different for each country. I have tried to keep each of the countries core data in line with the colour of the map. There are some pictures to add context for the region. This is a nice to have though.


The following is the Excel infographic which makes up the file.  Enjoy.

Nordic Infographic.xlsx

Tags Nordic, scandinavian, Infographic, excel
← Excel Create Child Sheets From Master Open Excel Update File →

Featured Posts

Excel Dashboards: Tracking a Crisis

Excel Dashboards: Tracking a Crisis
April 14, 2020

Recent Posts

Populating an Excel Table from a Range of Cells with VBA

Populating an Excel Table from a Range of Cells with VBA June 12, 2025

Fuzzy Distribution with Randbetween

Fuzzy Distribution with Randbetween May 21, 2025

Add Minimum and Maximum for Chart in Cells

Add Minimum and Maximum for Chart in Cells March 12, 2025

Inflation Over Multiple Years in a Single Cell

Inflation Over Multiple Years in a Single Cell January 10, 2025

Hubspot Dashboard

Hubspot Dashboard October 3, 2024

Monthly Dashboard With Supporting Metrics

Monthly Dashboard With Supporting Metrics September 25, 2024

Excel Show Missing Sheet Tabs

Excel Show Missing Sheet Tabs July 29, 2024

Run Macro Overnight Automatically

Run Macro Overnight Automatically June 24, 2024

Split File into Parts and Save to Directory

Split File into Parts and Save to Directory April 20, 2024

Most Popular Author

Most Popular Author December 14, 2023


Follow US:


MarcusSmall@thesmallman.com


TheSmallman.com - Making your small systems hum...
© Copyright 2013-2024 theSmallman.com All Rights Reserved.