Excel

TheSmallman.com

an XL ideas Lab

Dashboards VBA
  • Home
  • Dashboards
    • Tips & Tricks
    • Charts
    • Modelling
    • Infographics
    • VBA
  • Shop Dashboards
    • Power Pivot a User Guide
    • Excel Dashboard Course
    • Advanced Dashboard Course
    • Financial Modelling Course
    • Excel VBA Course
  • Blog
  • About
Menu

Excel Dashboards VBA

Street Address
City, State, Zip
Phone Number
an XL ideas Lab

Your Custom Text Here

Excel Dashboards VBA

  • Home
  • Dashboards
  • Excel Tips
    • Tips & Tricks
    • Charts
    • Modelling
    • Infographics
    • VBA
  • Shop Dashboards
  • PowerPivot
    • Power Pivot a User Guide
  • Courses
    • Excel Dashboard Course
    • Advanced Dashboard Course
    • Financial Modelling Course
    • Excel VBA Course
  • Blog
  • About

Showing Trends with a Chart

March 5, 2015 Marcus Small
Photo by Stephen Dawson on Unsplash

Photo by Stephen Dawson on Unsplash

Adding a bit of pizazz to charts can be difficult at times.  I tend to stick to what I know works when comparing say budget to actual.  What is nice is to add some trending data to the conversation.  I think it adds value from a visual perspective.  It is nothing the user cannot see when actual is against budget or forecast.  It just adds an extra element to the chart.  I prefer to add trend data as a Line chart rather than use Excel’s inbuilt trending tool.  There is more flexibility in the formatting of a Line chart.

Take the following chart with an added Line chart:

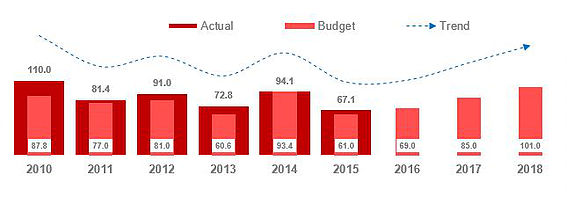
Actual is shown against Budget with the nice addition of a line chart.  The line chart shows the trend for the data in the Clustered Column and the Stacked Column charts.

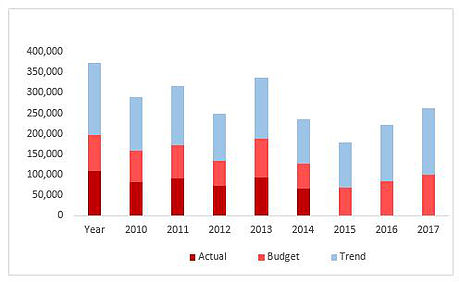
The way you make the above chart is to create a Clustered column chart with Actual Budget and Trend data

Now right click on the blue trend data and choose Line Chart.

Notice how the blue is selected by right clicking on the blue series (trend).

From the dialog which comes up choose Line chart from the drop down.

I have used Actual, Budget and Trend.  For the Budget and Trend put a tick in the secondary axis and change the budget to a Stacked Column Chart.

The image above shows the newly created series types with the two secondary axis.

Now all we need to do is to add an arrow head to our data and format it a bit.

Click on the line chart and choose Fill and Line from the Format Data series menu.

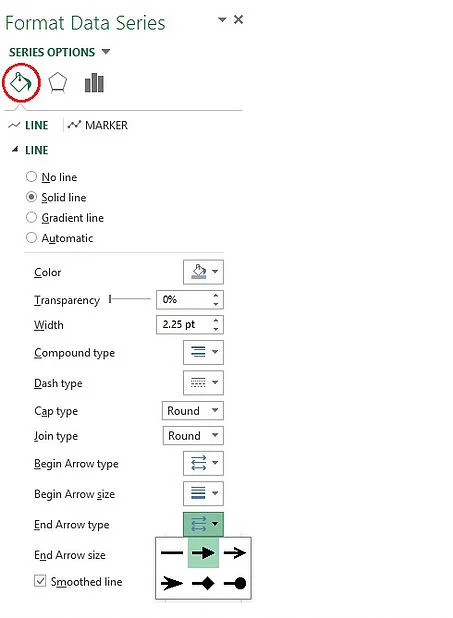
Choose and end arrow size, choose an end arrow size and choose smoothed line.

With a little bit of formatting your chart should look something like this.

Both axis I will hide and you may need to fiddle with the scale of the right horizontal axis.  Once I start to format the chart and add a bit more bling, the chart ends up looking as follows.

The data works nicely along with the source data.  The excel file attached has the above chart and the source data.  The trend above says 0 but I have hidden these values as I only want to see the trend not plot the data.

TrendChartSmallman.xlsx

Tags Excel, Charts, Trends
← A Self Colouring Waterfall ChartFilter Data in VBA without an Excel Filter →

Featured Posts

Excel Dashboards: Tracking a Crisis

Excel Dashboards: Tracking a Crisis
April 14, 2020

Recent Posts

Populating an Excel Table from a Range of Cells with VBA

Populating an Excel Table from a Range of Cells with VBA June 12, 2025

Fuzzy Distribution with Randbetween

Fuzzy Distribution with Randbetween May 21, 2025

Add Minimum and Maximum for Chart in Cells

Add Minimum and Maximum for Chart in Cells March 12, 2025

Inflation Over Multiple Years in a Single Cell

Inflation Over Multiple Years in a Single Cell January 10, 2025

Hubspot Dashboard

Hubspot Dashboard October 3, 2024

Monthly Dashboard With Supporting Metrics

Monthly Dashboard With Supporting Metrics September 25, 2024

Excel Show Missing Sheet Tabs

Excel Show Missing Sheet Tabs July 29, 2024

Run Macro Overnight Automatically

Run Macro Overnight Automatically June 24, 2024

Split File into Parts and Save to Directory

Split File into Parts and Save to Directory April 20, 2024

Most Popular Author

Most Popular Author December 14, 2023


Follow US:


MarcusSmall@thesmallman.com


TheSmallman.com - Making your small systems hum...
© Copyright 2013-2024 theSmallman.com All Rights Reserved.