
This post is a post from a linked in article I published.
A couple of weeks back I presented to the University of Queensland Business Association on all things Excel – I covered the often neglected world of financial modelling. I always find it amusing that everyone seems to have their own peculiar style when it comes to modelling data in Excel. I was rather privileged to start my career with PWC who were all over the effective structure of an Excel spreadsheet (well at least in the area I worked in).
It seemed so simple to me – clearly segregate your data types into Inputs – Calculations and Outputs and flow your model from left to right like book. It has been the mantra I have stuck with it my entire career. What I have seen in practice is a mismatch of styles and design techniques which has left me scratching my head.
Why are we not teaching basic Excel design across the board at Universities? Why do Unis focus on theoretical financial concepts which I for one rarely if ever use (I have a Master’s degree in finance) when most of what today's analyst does, is cut up, isolate and present data all inside an Excel spreadsheet? At any rate I think Excel best practice should be taught at Uni so when you get hold of someone’s workbook at least you know how it has been wired. Sound logic and clear segregation between the various data types with the calculation flow going in the opposite direction to the physical layout (right to left, outputs to calcs, calcs to inputs........ simples!!!!!!!
Personally I love giving presentations to Uni students. They are like sponges, they want to learn and are not encumbered with poor technique that has been ingrained with the sands of time.
It was a 2 hour presentation so in the first hour we will build a financial model – I know right not long enough – well I have just included a few formulations which are important in my opinion – these include:
SUMPRODUCT / SUMIFS
LOOKUP / INDEX MATCH
IF, IFS, AND, OR
MID, LEFT, RIGHT, CELL
OFFSET
Finally we made the odd pivot table.
Secondly I showed them what I have stolen from JRR Tolkien which I boldly entitle – ONE CELL TO RULE THEM ALL. How to build in UBER flexibility so you can report on multiple metrics at the touch of a button or the turning of a combo box.
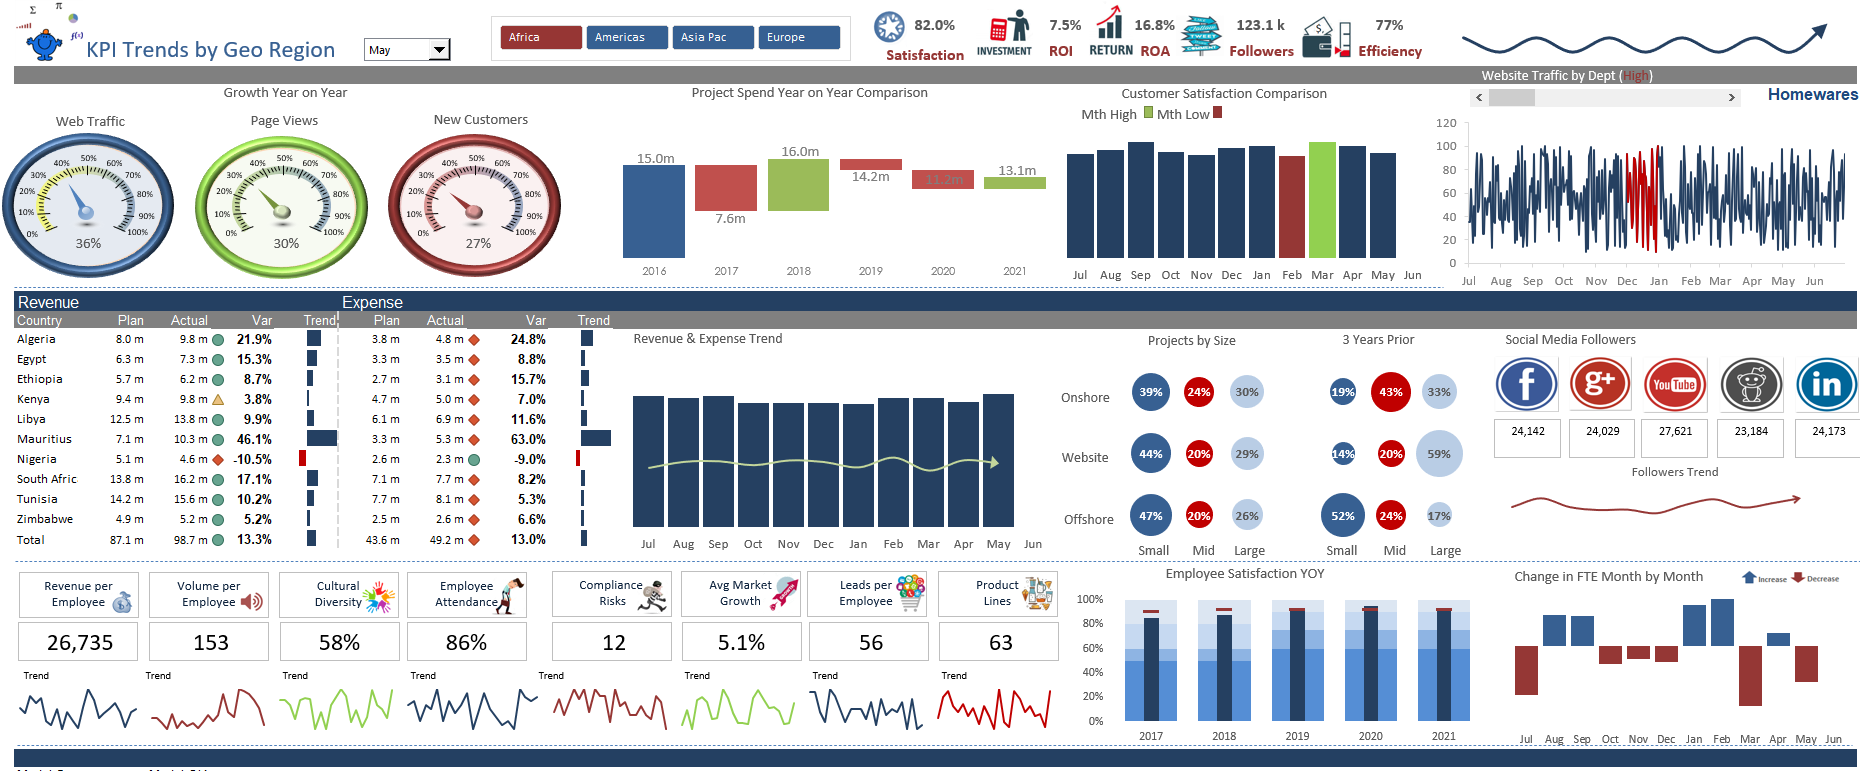
The top picture is the output from that lesson. This is something I put together exclusively for the UQBA – I just have to work out how to incorporate it into one of my full day presentations.


