

The task of turning a dataset into a tabular form can often require a coding solution. Quite often a line description is used as a header of sorts. With multiple descriptions it can often be frustrating to find them and fill them down – time consuming as well. With each iteration of the template naturally being different this task can be a real let down. Enter VBA and the power of the autofilter. I have many articles on the autofilter this is yet another practical application for this fantastic tool. I was recently asked to work with a dataset which was structured in the following way.
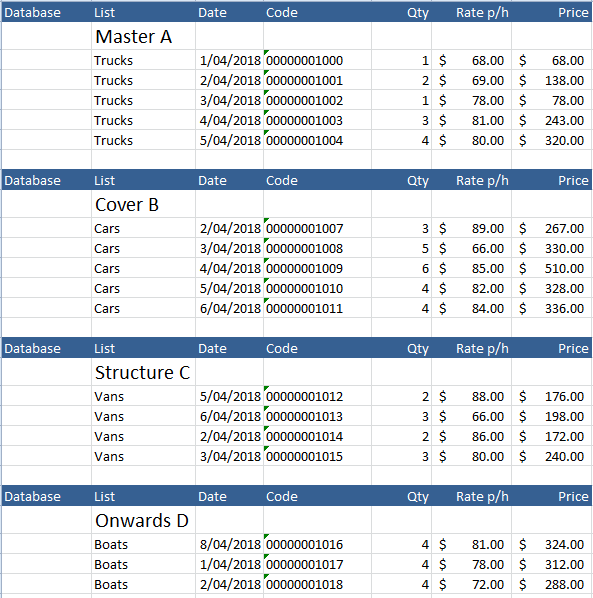
With the data in bold being the data that needed to be next to the information it is describing. The advantage of having the data in a database format is that it can be used as a filter criteria to trap like data. In its original form this cannot be done.

Notice how column A is now in a tabular format. The data in each row can be tapped by its description now. This is very useful and makes the data easier to work with. Now every dataset will be slightly different so creating code that works for everyone will be close to impossible. I have tried to make the following as generic as possible. However, you will have to structure it to suit your needs.
Option Explicit
Sub ColAVals()
Dim i As Integer
Dim j As Integer
Dim visRng As Range
Dim r As Range
Application.ScreenUpdating = False
ActiveSheet.AutoFilterMode = False
Range("D1", Range("D65536").End(xlUp)).AutoFilter 1, "Code" 'Filter the range in Col D
Set visRng = Range("D1", [D1].End(xlDown)).SpecialCells(xlCellTypeVisible) 'Trap header rows
i = 2 Data starts in ROW 2
For Each r In visRng.Rows 'Loop through rows in filtered range
Range("A" & r.Row + i) = Range("B" & r.Row + i - 1).Value
ActiveSheet.AutoFilterMode = False
j = Range("B" & r.Row + i, Range("B" & r.Row + i).End(xlDown)).Count + i - 1
Range("A" & r.Row + i).AutoFill Range("A" & r.Row + i, Range("A" & r.Row + j))
Range("D1", [D500].End(xlUp)).AutoFilter 1, "Code" 'Trap header rows
Next
ActiveSheet.AutoFilterMode = False
Application.ScreenUpdating = True
End Sub
The procedure draws heavily on the autofilter to trap the length of the range and the row numbers in question. The autofilter saves us looping through the entire column and testing each cell for a condition. In essence it saves a lot of time.
There is a file attached to help crystallise the workings – hope this practical example is something you can use and expand upon.


