Excel

TheSmallman.com

an XL ideas Lab

Dashboards VBA
  • Home
  • Dashboards
    • Tips & Tricks
    • Charts
    • Modelling
    • Infographics
    • VBA
  • Shop Dashboards
    • Power Pivot a User Guide
    • Excel Dashboard Course
    • Advanced Dashboard Course
    • Financial Modelling Course
    • Excel VBA Course
  • Blog
  • About
Menu

Excel Dashboards VBA

Street Address
City, State, Zip
Phone Number
an XL ideas Lab

Your Custom Text Here

Excel Dashboards VBA

  • Home
  • Dashboards
  • Excel Tips
    • Tips & Tricks
    • Charts
    • Modelling
    • Infographics
    • VBA
  • Shop Dashboards
  • PowerPivot
    • Power Pivot a User Guide
  • Courses
    • Excel Dashboard Course
    • Advanced Dashboard Course
    • Financial Modelling Course
    • Excel VBA Course
  • Blog
  • About

Social Media Dashboard in Excel

April 5, 2018 Marcus Small
Excel Dashboard Social Media


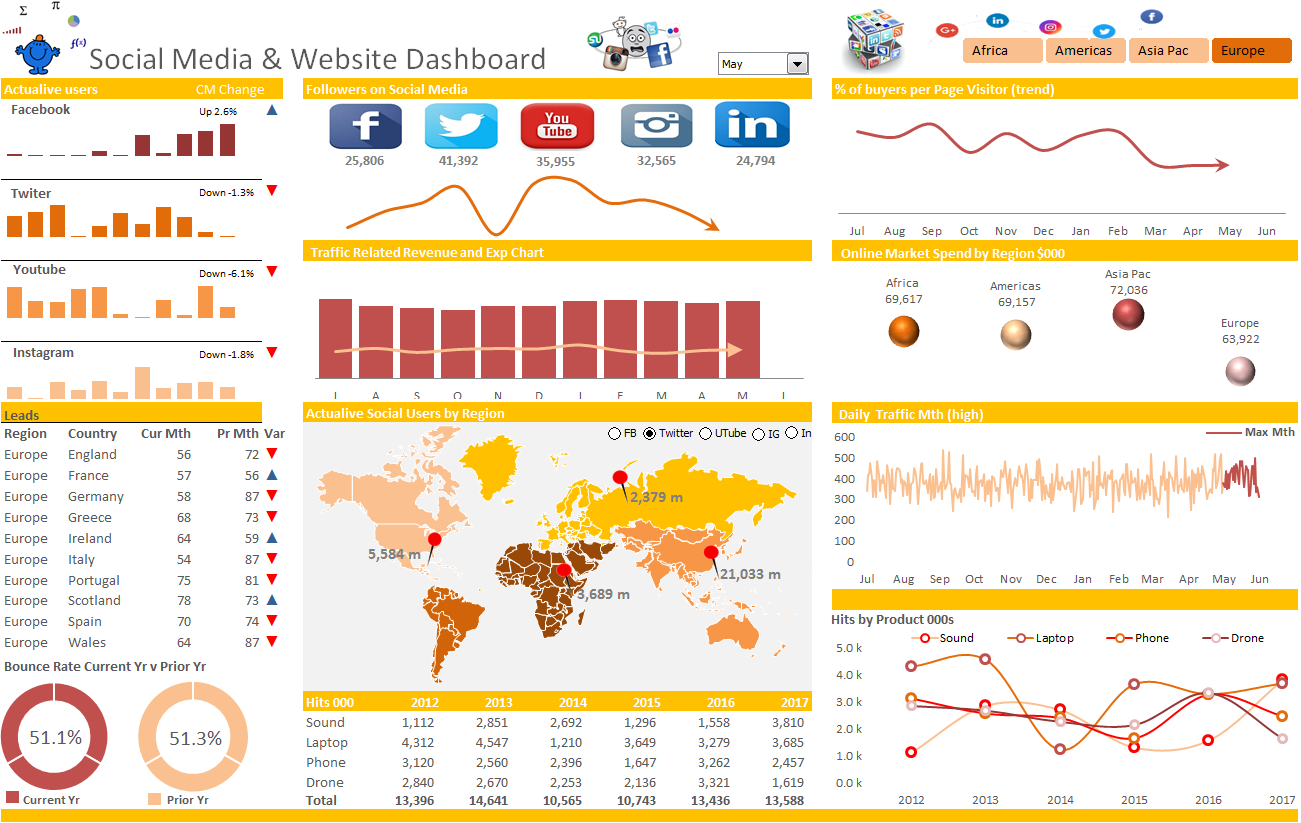
Here is another take on a social dashboard in Excel.  It is a bit different from my first attempt many years ago.  The data is arranged in a very different way - there is more data this time.  In the world of dashboarding you are only limited by your own imagination which in my opinion is limitless.

This dashboard takes a large amount of data over a number of metrics and presents the main elements into a succinct summary.  The dashboard moves via a slicer on geographic region and a combo box which restricts the viewing to the year to date depending on the month chosen.  The use of the NA function is the key behind hiding data which you don't want to see.  Have a good look at the workings and the file set up.  If you are familiar with the files on this site you will see a common pattern.

Enjoy the journey!


Tags Excel, Dashboard, Social media
← Excel Autofill - Fill Down to Bottom of RangeRange Areas in Excel with VBA →

Featured Posts

Excel Dashboards: Tracking a Crisis

Excel Dashboards: Tracking a Crisis
April 14, 2020

Recent Posts

Populating an Excel Table from a Range of Cells with VBA

Populating an Excel Table from a Range of Cells with VBA June 12, 2025

Fuzzy Distribution with Randbetween

Fuzzy Distribution with Randbetween May 21, 2025

Add Minimum and Maximum for Chart in Cells

Add Minimum and Maximum for Chart in Cells March 12, 2025

Inflation Over Multiple Years in a Single Cell

Inflation Over Multiple Years in a Single Cell January 10, 2025

Hubspot Dashboard

Hubspot Dashboard October 3, 2024

Monthly Dashboard With Supporting Metrics

Monthly Dashboard With Supporting Metrics September 25, 2024

Excel Show Missing Sheet Tabs

Excel Show Missing Sheet Tabs July 29, 2024

Run Macro Overnight Automatically

Run Macro Overnight Automatically June 24, 2024

Split File into Parts and Save to Directory

Split File into Parts and Save to Directory April 20, 2024

Most Popular Author

Most Popular Author December 14, 2023


Follow US:


MarcusSmall@thesmallman.com


TheSmallman.com - Making your small systems hum...
© Copyright 2013-2024 theSmallman.com All Rights Reserved.