

Have you ever had to deal in someone else’s data and it is full of spare lines and dodgy formatting. It is frustrating from a programming perspective as it is often difficult to coral data when it is dispersed. Enter the power of the area within a range. You can trap data in an area and manipulate it then move onto the next area in a given range. It is a wonderful part of the VBA language and like anything having it in your tool kit might be just the ticket one day – you never know when you will have to draw on this Excel knowledge. My time came this week when a client wanted me to build an individual invoice from the ground up like 140 times. The output needed to be in a weird shape with lots of lines between each dataset. I knew about areas but had not used them in a practical way. So I drew on my knowledge to kick the ball into the back of the net.
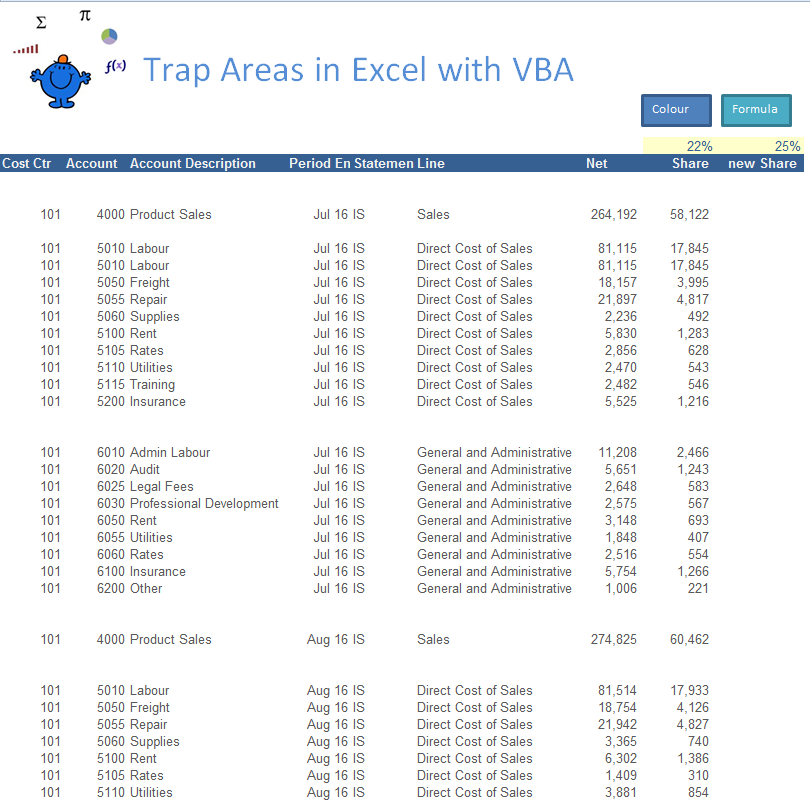
The above shows how the data is set out with gaps between each dataset. It can be very frustrating to work with when data is not tabular.
This is how you can trap an area in column A. In my example the data is split into data which is separated into lines. I want to manipulate each dataset in turn. Here is how you do it with an area. We will create a simple loop then trap each area in turn.
Option Explicit
Sub LoopArea()
Dim lr As Long
Dim area As Range
Dim sh As Worksheet
Set sh = ActiveSheet
lr = sh.Cells(Rows.Count, 1).End(xlUp).Row
'Constant based Area in Col A
For Each area In sh.Range("A13:A" & lr).SpecialCells(xlCellTypeConstants, 23).Areas
area.Interior.Color = vbGreen
Next area
'Formula based Area in Col H
For Each area In sh.Range("H13:H" & lr).SpecialCells(xlCellTypeFormulas).Areas
area.Interior.Color = vbBlue
Next area
End Sub
For Each area In sh.Range("A13:A" & lr).SpecialCells(xlCellTypeConstants, 23).Areas
area.Interior.Color = vbGreen
Next area
The second loop iterates through formulas in column H. This allows you a different way to iterate through an area.
For Each area In sh.Range("H13:H" & lr).SpecialCells(xlCellTypeFormulas).Areas
area.Interior.Color = vbBlue
Next area
It will make the relevant areas blue. I have included an Excel file as a sample to show how the technique might work. You could take the whole process a step further and add things like formula on the fly. Here is how you might do that to Column i.
Option Explicit
Sub LoopAreaFormula()
Dim lr As Long
Dim area As Range
Dim shAs Worksheet
Set sh = ActiveSheet
lr = sh.Cells(Rows.Count, 1).End(xlUp).Row
'Formula based Area in Col i
For Each area In sh.Range("H13:H" & lr).SpecialCells(xlCellTypeFormulas).Areas
area.Offset(, 1).FormulaR1C1 = "=RC[-2]*R9C9"
Next area
End Sub
You can see after you run the procedure that a new column of formula is added for all the areas in a given range. It skips all of the blanks and works beautifully.
Here is the Excel file to go with the post.


