Excel

TheSmallman.com

an XL ideas Lab

Dashboards VBA
  • Home
  • Dashboards
    • Tips & Tricks
    • Charts
    • Modelling
    • Infographics
    • VBA
  • Shop Dashboards
    • Power Pivot a User Guide
    • Excel Dashboard Course
    • Advanced Dashboard Course
    • Financial Modelling Course
    • Excel VBA Course
  • Blog
  • About
Menu

Excel Dashboards VBA

Street Address
City, State, Zip
Phone Number
an XL ideas Lab

Your Custom Text Here

Excel Dashboards VBA

  • Home
  • Dashboards
  • Excel Tips
    • Tips & Tricks
    • Charts
    • Modelling
    • Infographics
    • VBA
  • Shop Dashboards
  • PowerPivot
    • Power Pivot a User Guide
  • Courses
    • Excel Dashboard Course
    • Advanced Dashboard Course
    • Financial Modelling Course
    • Excel VBA Course
  • Blog
  • About

Construction Industry Infographic

March 8, 2018 Marcus Small
Revenue and Expense Infographic Construction

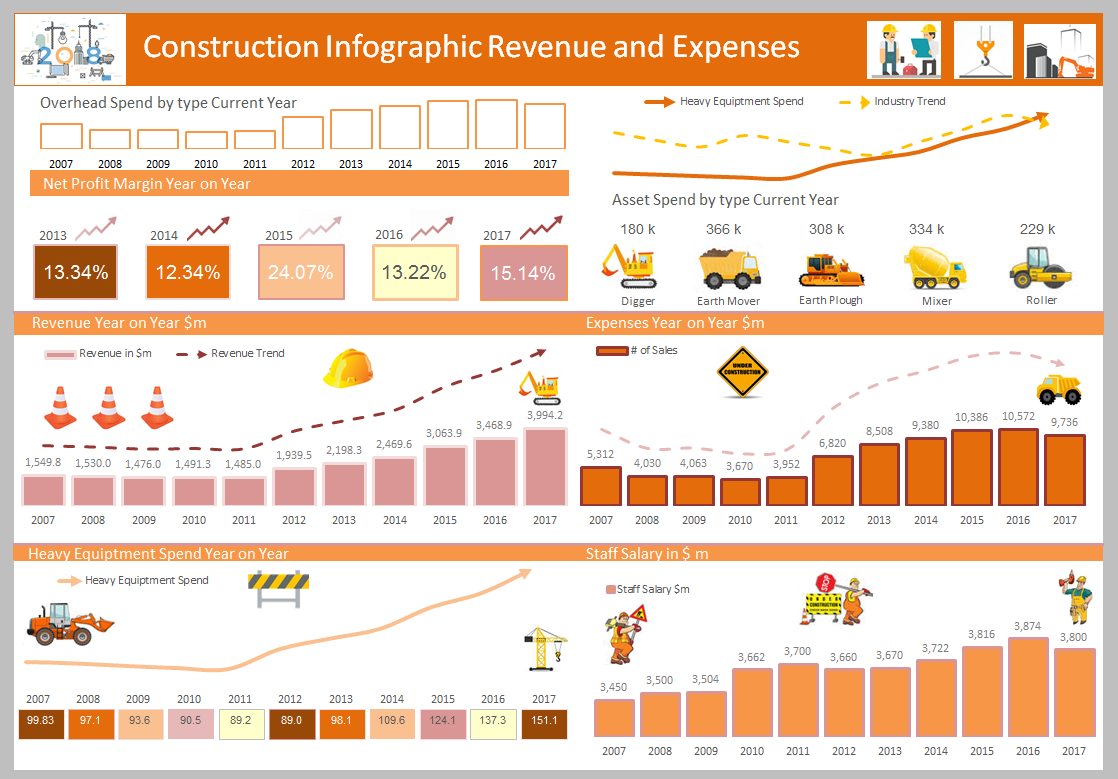
I have not added a completed infographic in a while so here is a little diddy I just completed.  It displays the fortunes of a fictional construction company.  The mechanics in the back end of Excel are quite simple and it would be very easy to change it from an annual model to a monthly model by changing the headings.  All of the data is in a simple table which can be updated and expanded by opening up the grouped menu.  It gives a clean overview on some key metrics within the company and can be applied to your industry too.


The file that sits behind this infographic is below.   Enjoy.

Construction.xlsx

Tags Excel, indographic, construction, Revenue, Expense, Asset
← Range Areas in Excel with VBAMore Dashboard Updates →

Featured Posts

Excel Dashboards: Tracking a Crisis

Excel Dashboards: Tracking a Crisis
April 14, 2020

Recent Posts

Populating an Excel Table from a Range of Cells with VBA

Populating an Excel Table from a Range of Cells with VBA June 12, 2025

Fuzzy Distribution with Randbetween

Fuzzy Distribution with Randbetween May 21, 2025

Add Minimum and Maximum for Chart in Cells

Add Minimum and Maximum for Chart in Cells March 12, 2025

Inflation Over Multiple Years in a Single Cell

Inflation Over Multiple Years in a Single Cell January 10, 2025

Hubspot Dashboard

Hubspot Dashboard October 3, 2024

Monthly Dashboard With Supporting Metrics

Monthly Dashboard With Supporting Metrics September 25, 2024

Excel Show Missing Sheet Tabs

Excel Show Missing Sheet Tabs July 29, 2024

Run Macro Overnight Automatically

Run Macro Overnight Automatically June 24, 2024

Split File into Parts and Save to Directory

Split File into Parts and Save to Directory April 20, 2024

Most Popular Author

Most Popular Author December 14, 2023


Follow US:


MarcusSmall@thesmallman.com


TheSmallman.com - Making your small systems hum...
© Copyright 2013-2024 theSmallman.com All Rights Reserved.