
The UNIQUE formula has really changed the game in Excel as a way to interrogate a list and return all of the unique items in that list. In the past we could use the pivot table or advanced filter to generate unique items in a list or attempt some quite complex array formula. It is succinct and produces the results in an array very quickly.
The following formula:
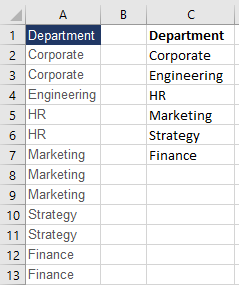
=UNIQUE($A$1:$A$13)
This produces the result and the ensuing array range is automatically added so no fill down is required. I have added the header row so department appears at the top. If we wanted the data in ascending order we would leave off the first row and incorporate the SORT formula.
The following formula:
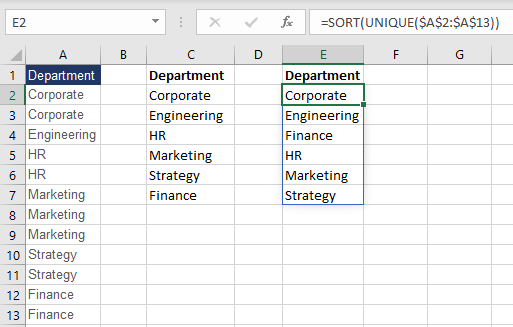
=SORT(UNIQUE($A$2:$A$13))
By default Excel will sort in ascending order. Let’s say for example we wanted to store the list in descending order.
The following formula:
=SORT(UNIQUE($A$2:$A$13),,-1)
To change the data back to ascending the -1 becomes 1.
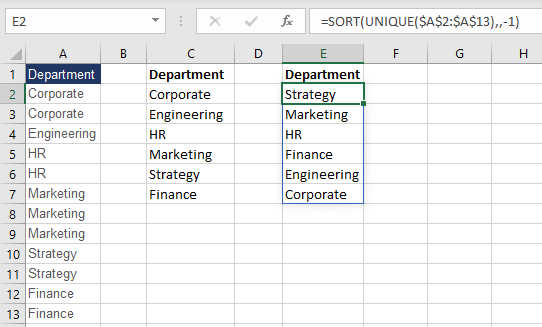
Sort unique in descending order.


